Diagram Template Gallery
Browse professional diagram templates and instantly generate customized diagrams with AI. Simply select a template and let Diagramming AI transform it into your perfect diagram in seconds.
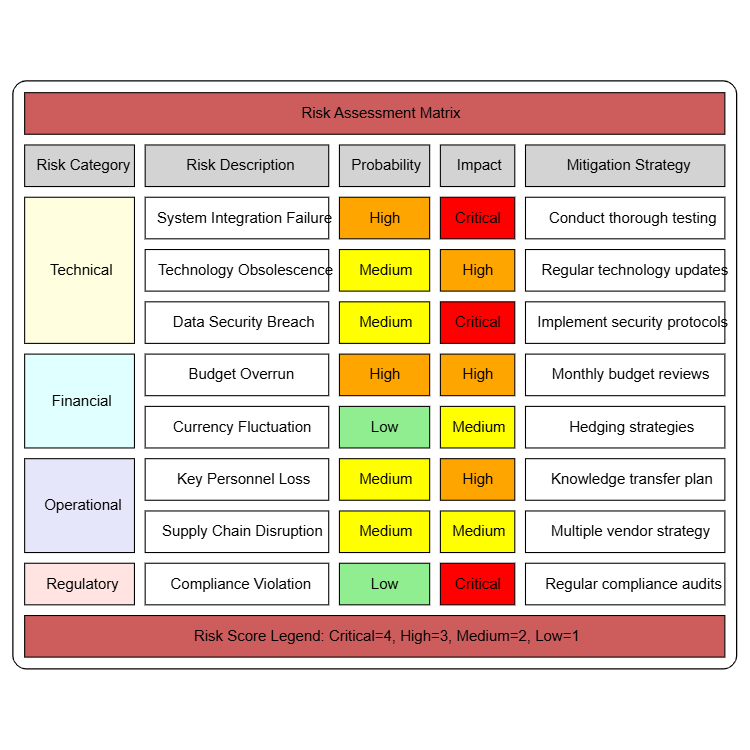
Risk Assessment Matrix
Risk analysis matrix with probability, impact, and mitigation strategies

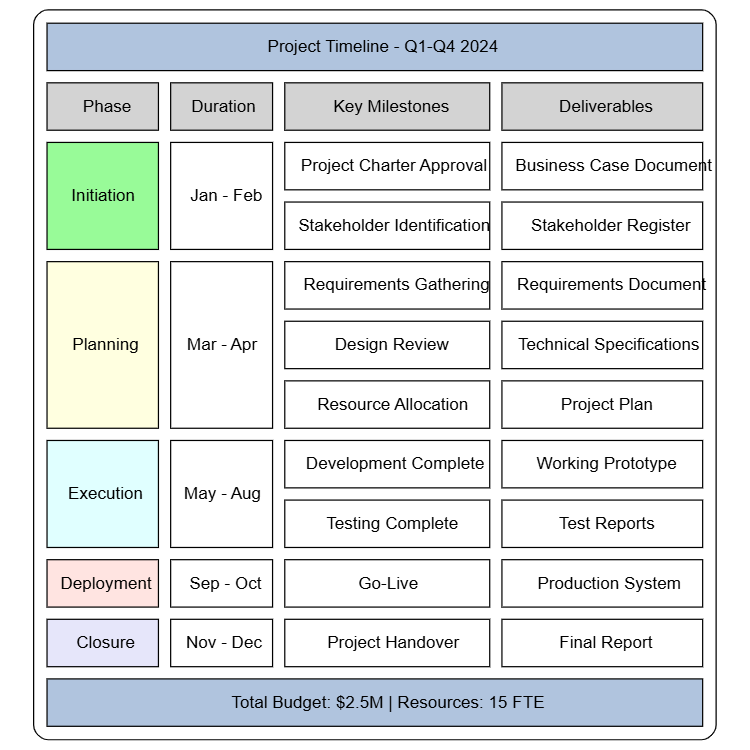
Project Timeline
Project phases with milestones and deliverables in block table format

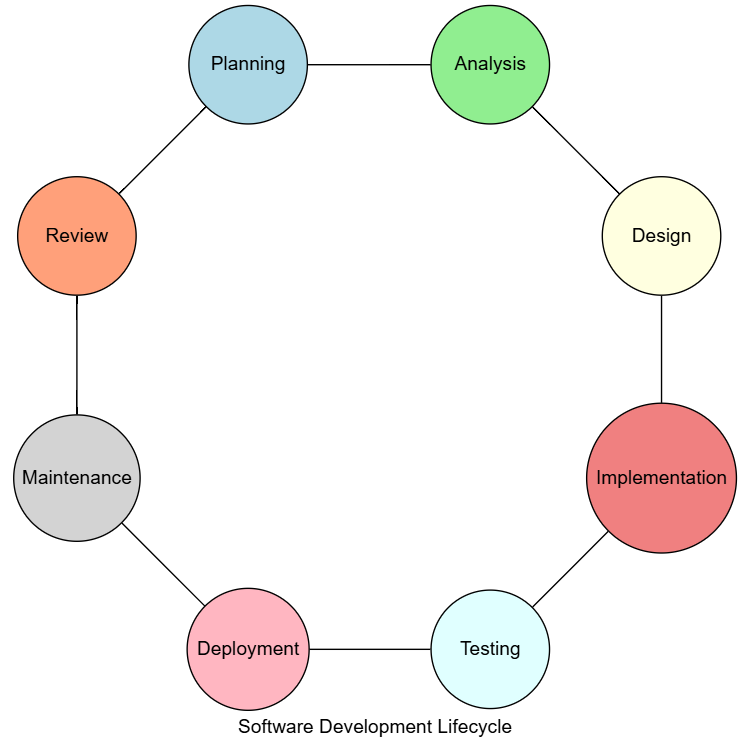
Software Development Lifecycle
Circular flow of software development phases from planning through maintenance

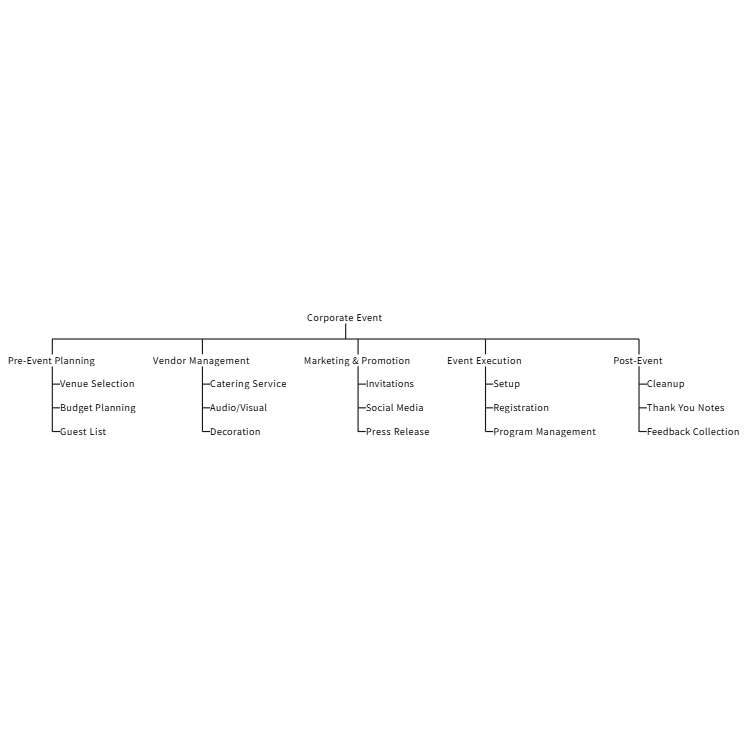
Event Planning WBS
Compact event planning work breakdown structure without boxes

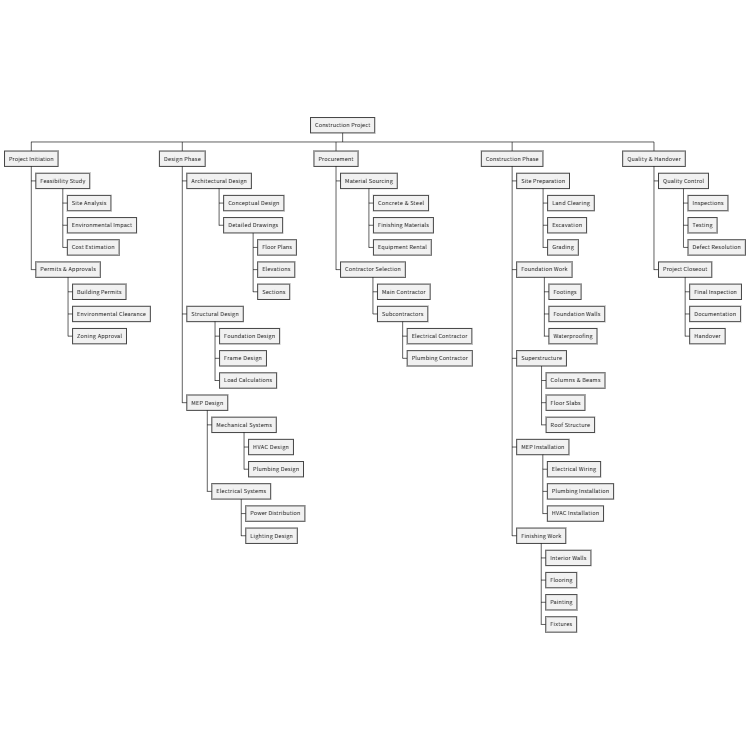
Construction Project WBS
Comprehensive construction project work breakdown structure with multiple phases

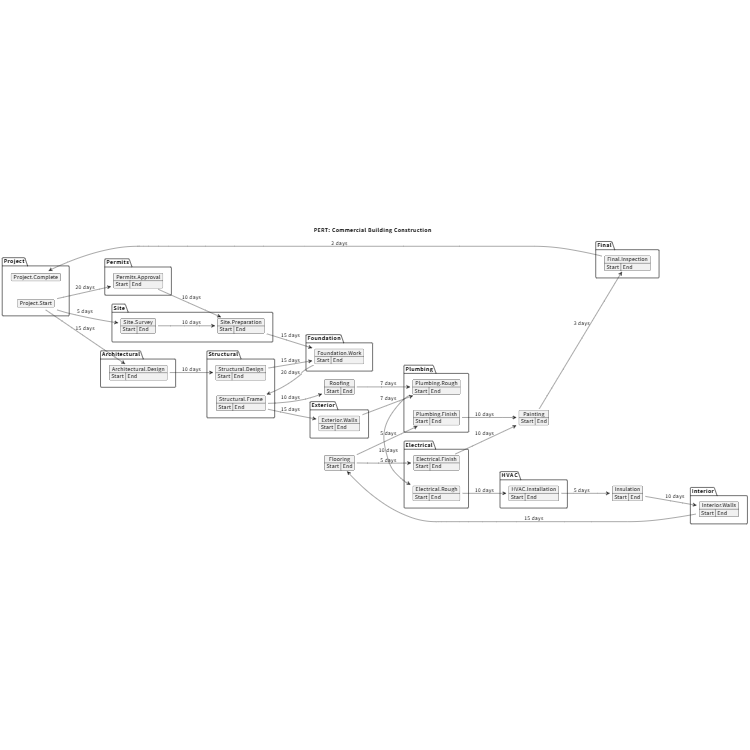
Construction Project Management
Comprehensive PERT chart for building construction project

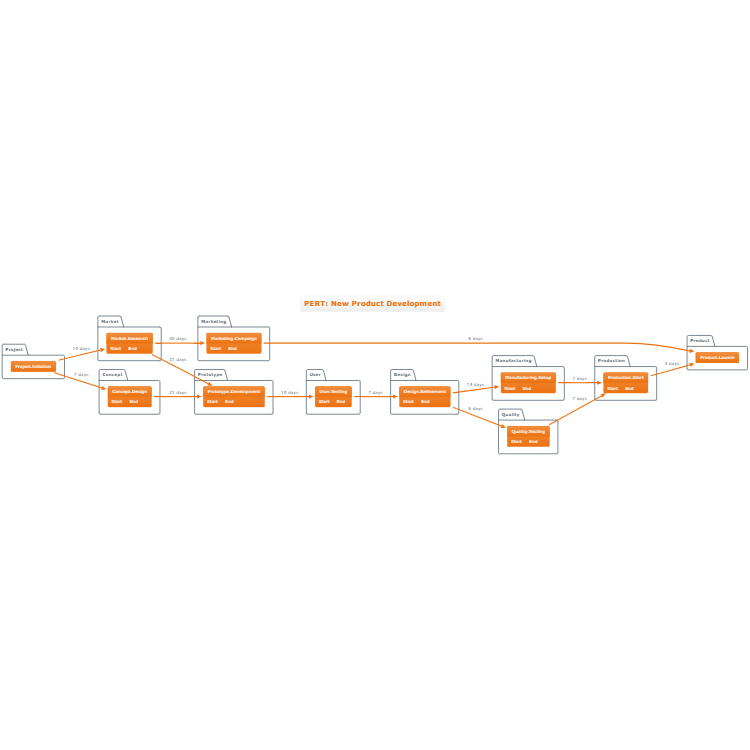
Product Development Project
Standard PERT chart for product development with multiple phases

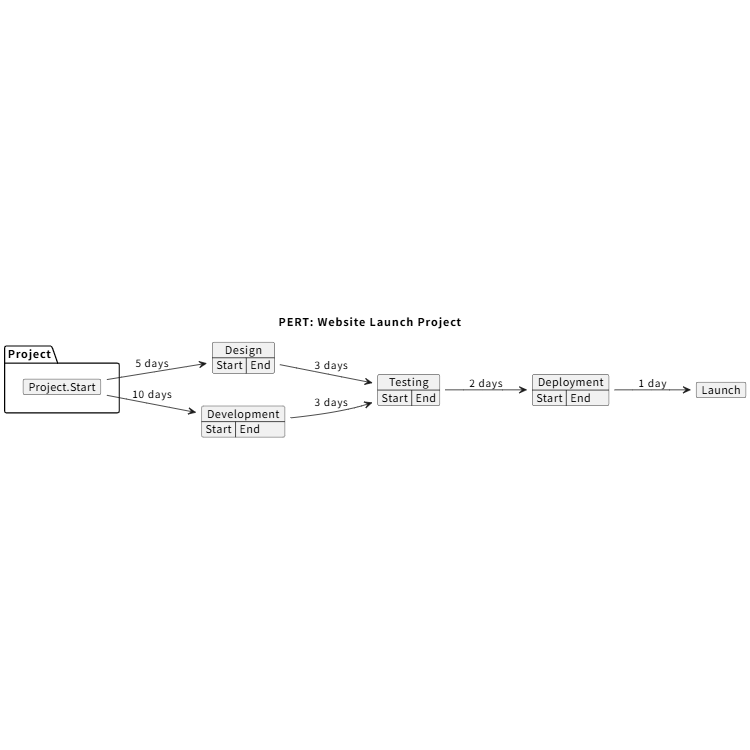
Website Launch Project
Compact PERT chart for website launch project

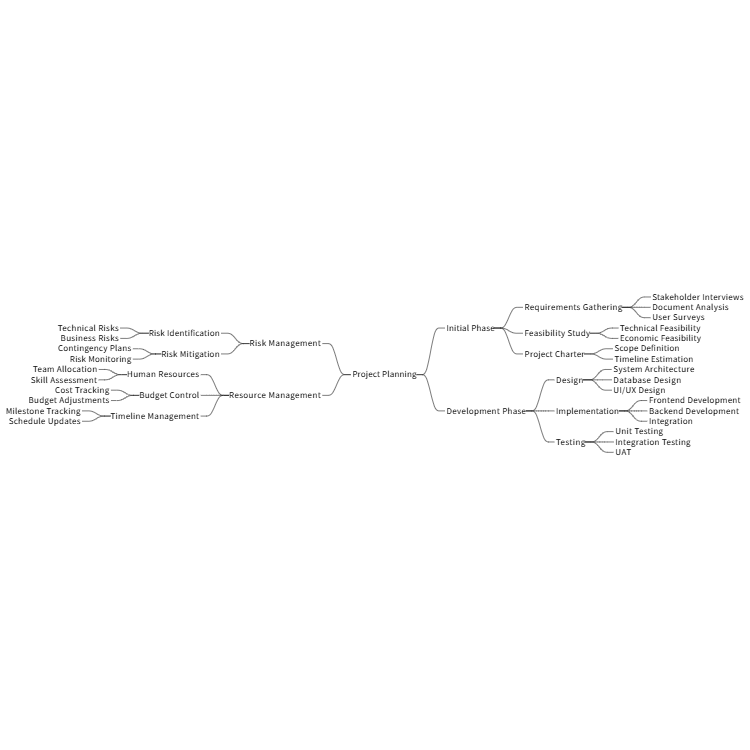
Project Planning Mind Map
Standard project planning with phases on both sides without boxes

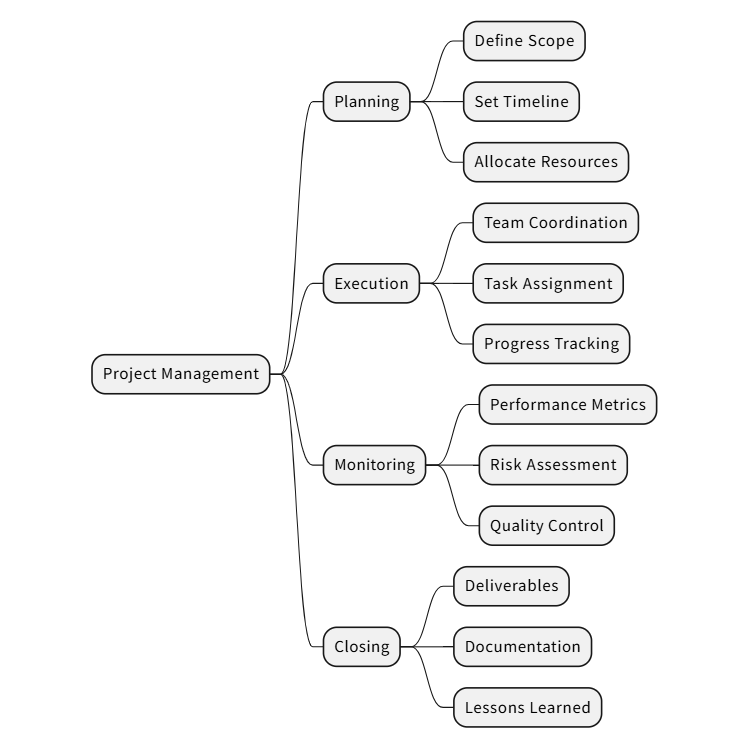
Project Management Mind Map
Compact project management structure mind map

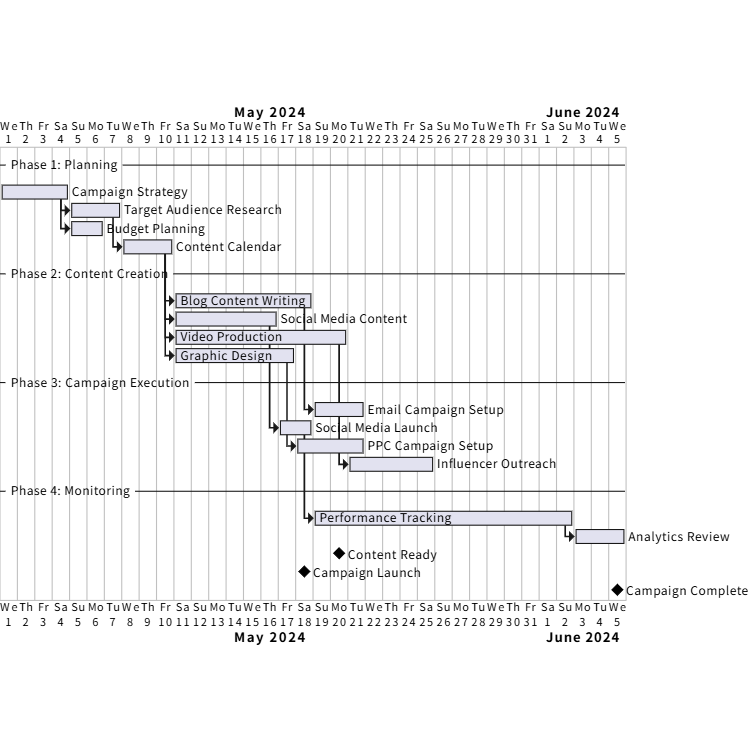
Marketing Campaign Schedule
Standard marketing campaign Gantt chart with phases and milestones

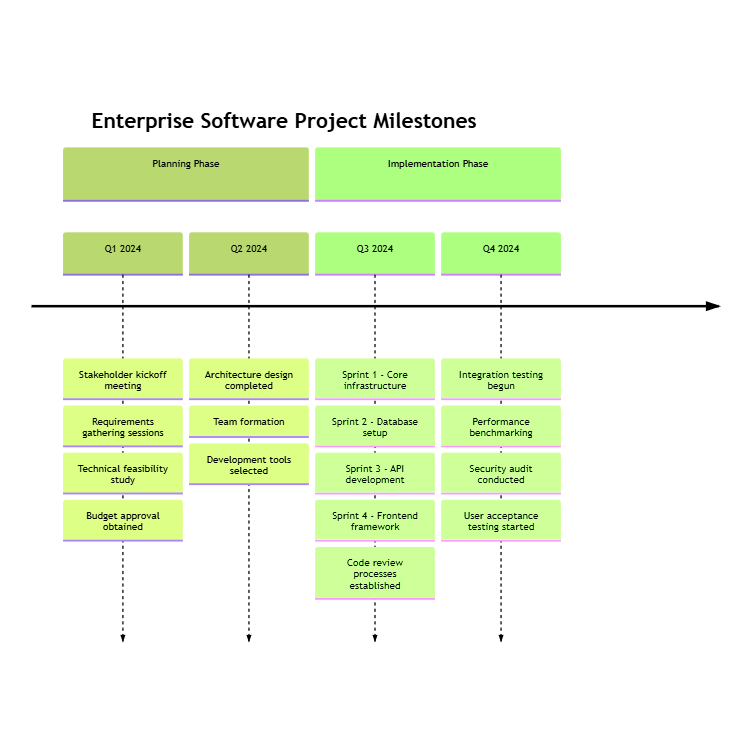
Project Milestones
Timeline with many items per date showing project milestones and activities

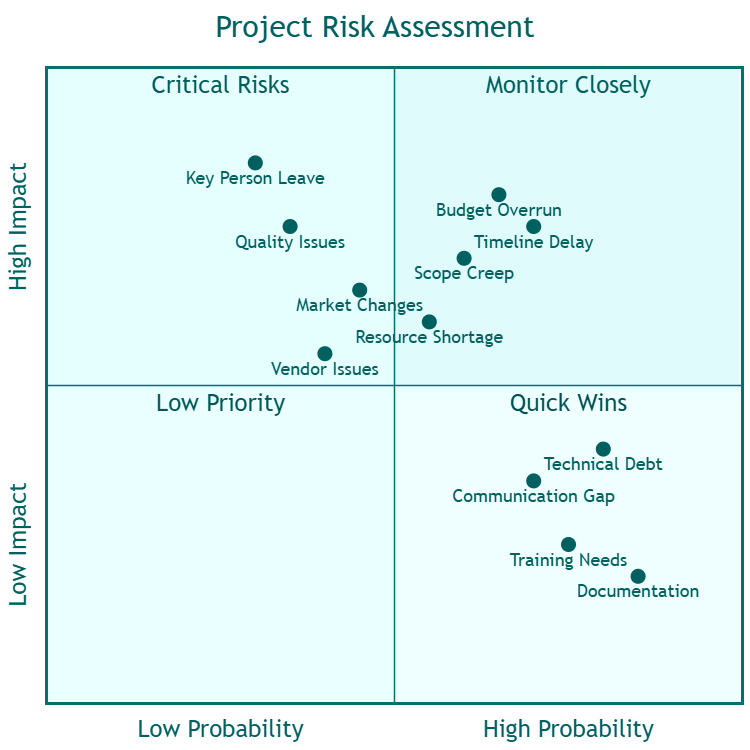
Risk Assessment Matrix
Project risk evaluation based on probability and impact

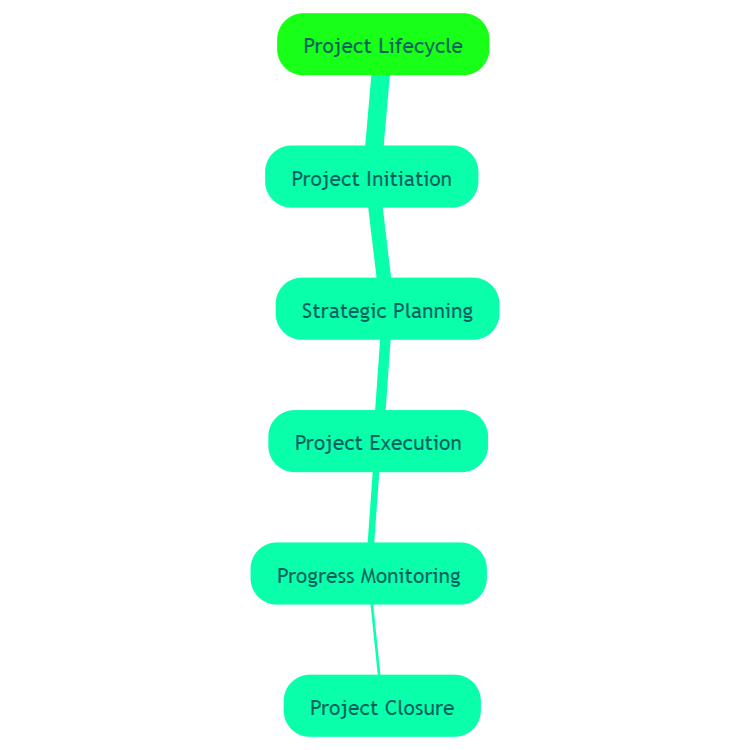
Project Lifecycle
Deep branch mindmap showing sequential project lifecycle

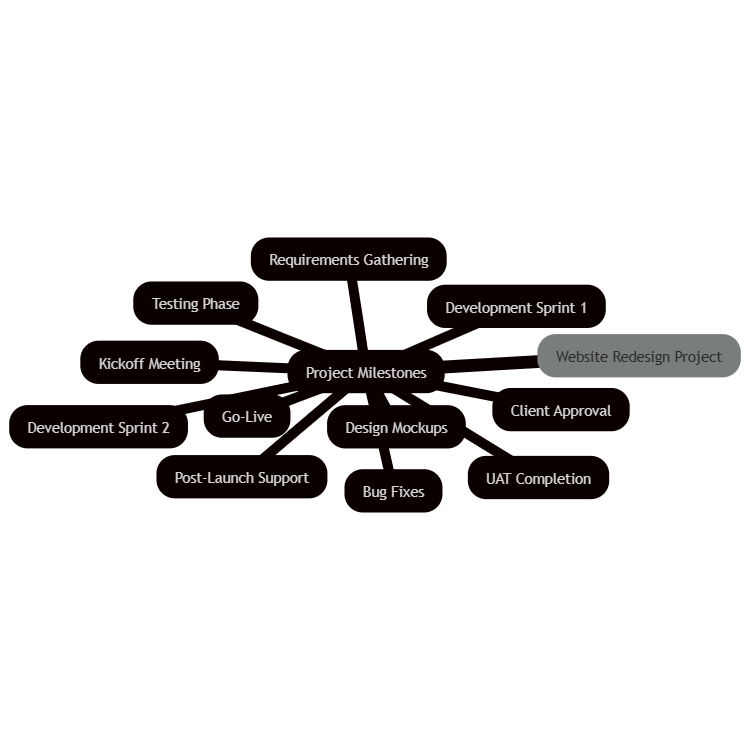
Project Milestones
Single branch mindmap showing project milestones

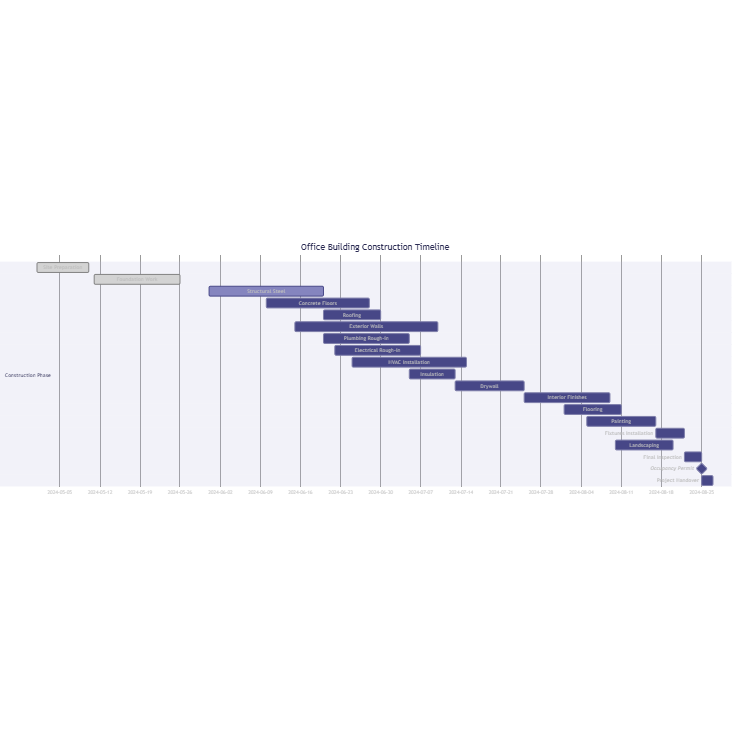
Construction Project
Single section construction project timeline with overlapping activities

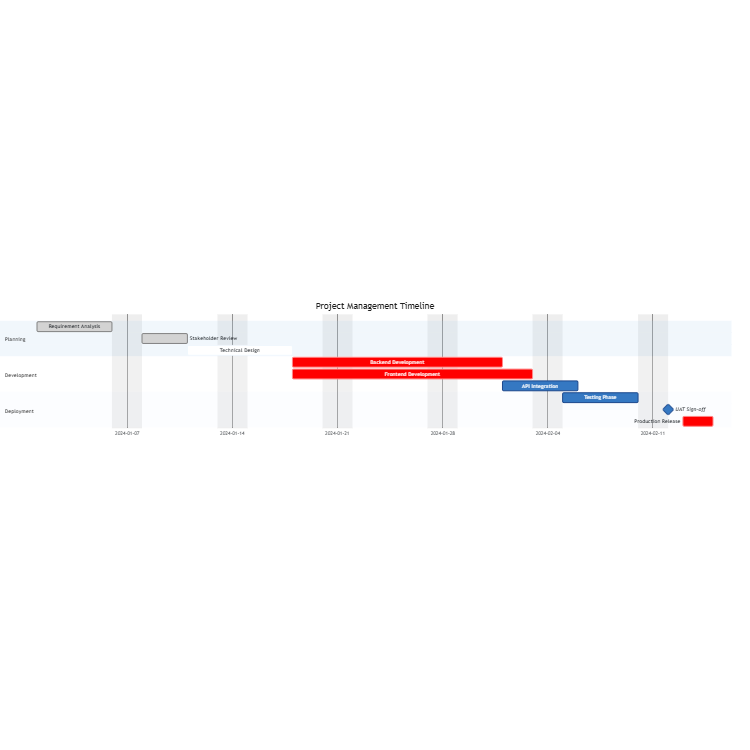
Project Management Timeline
Software project timeline with planning, development, and deployment phases

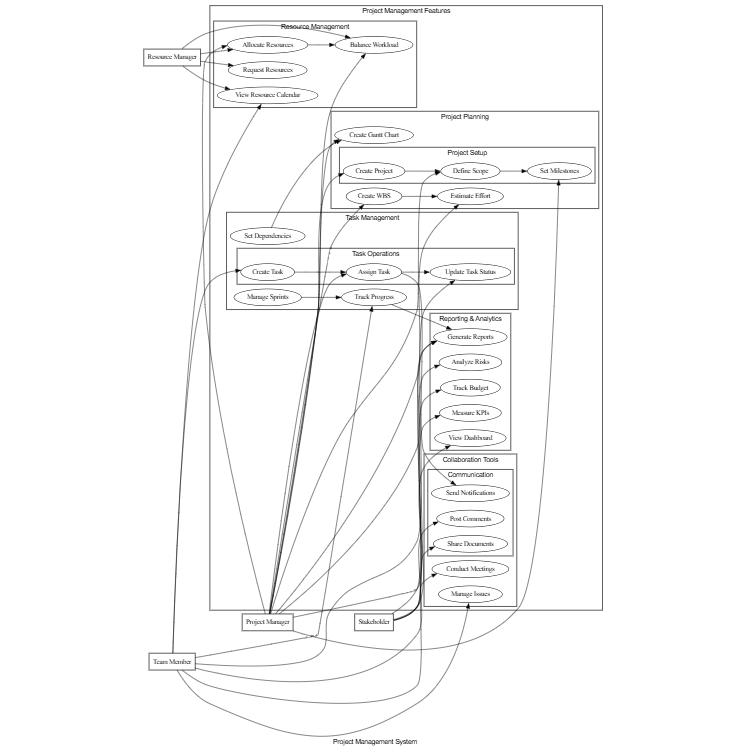
Project Management System
Use case diagram for PM tool with tasks, resources, reporting, and collaboration features

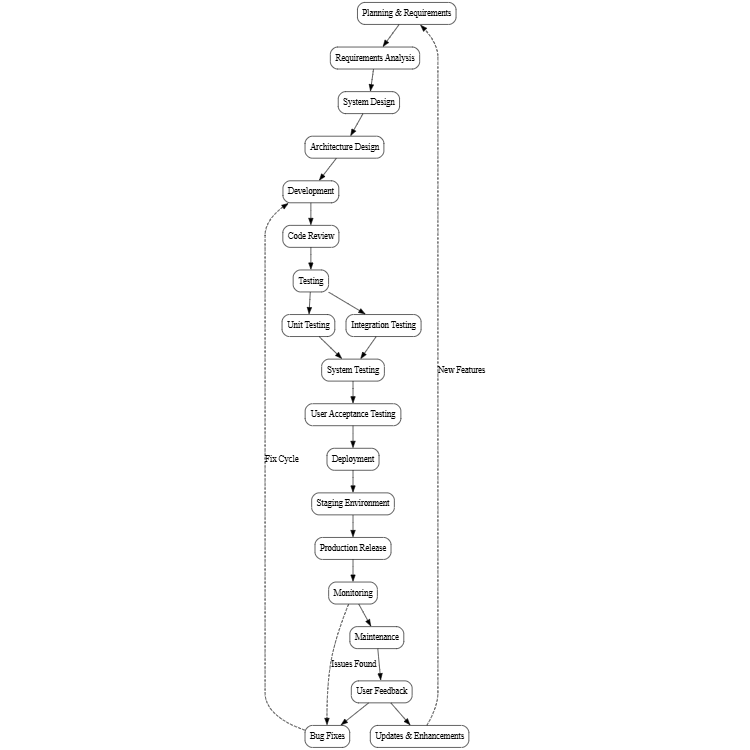
Software Development Lifecycle
Complete software development lifecycle showing phases from planning to maintenance

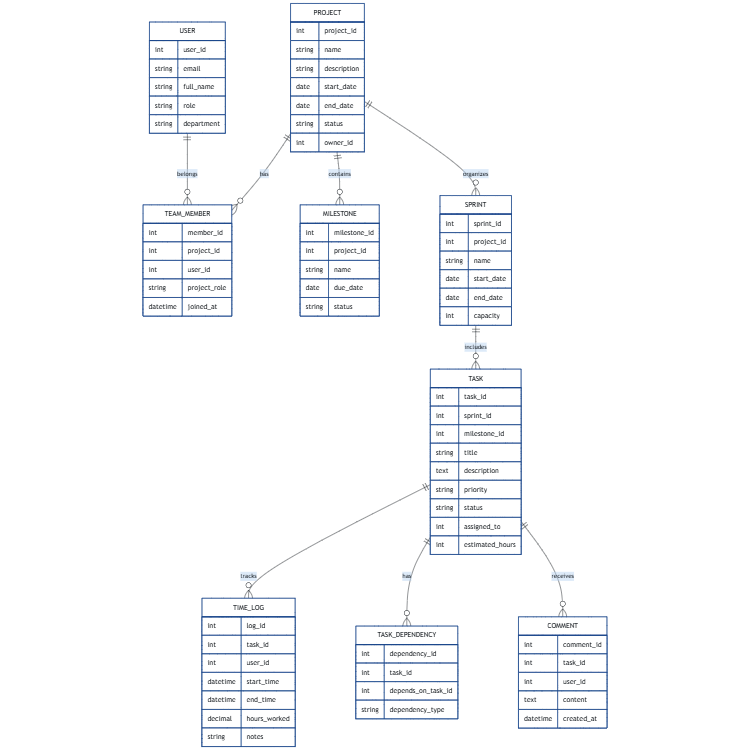
Project Management System
Comprehensive project management database with teams, tasks, milestones, and time tracking

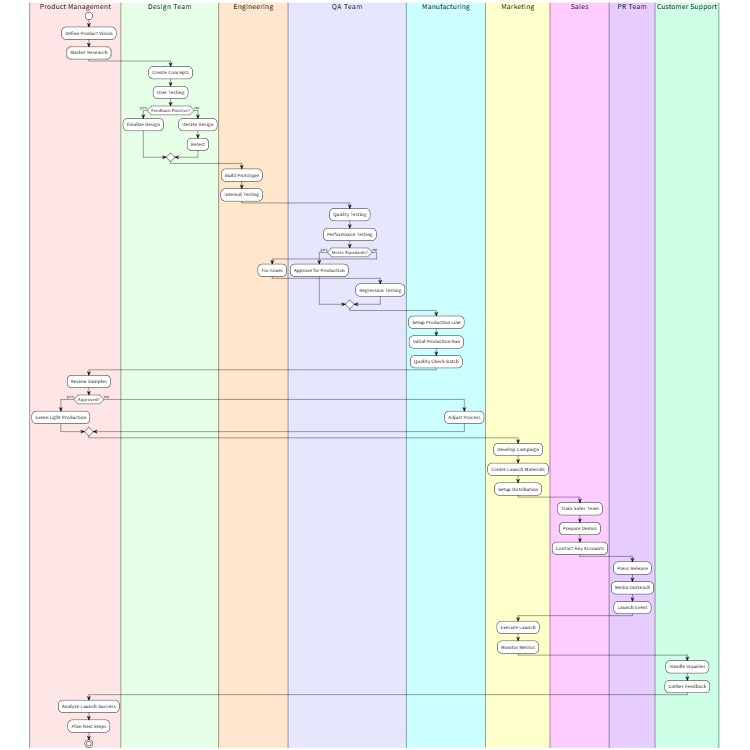
Product Launch Process
Comprehensive product launch workflow with colored swimlanes across departments

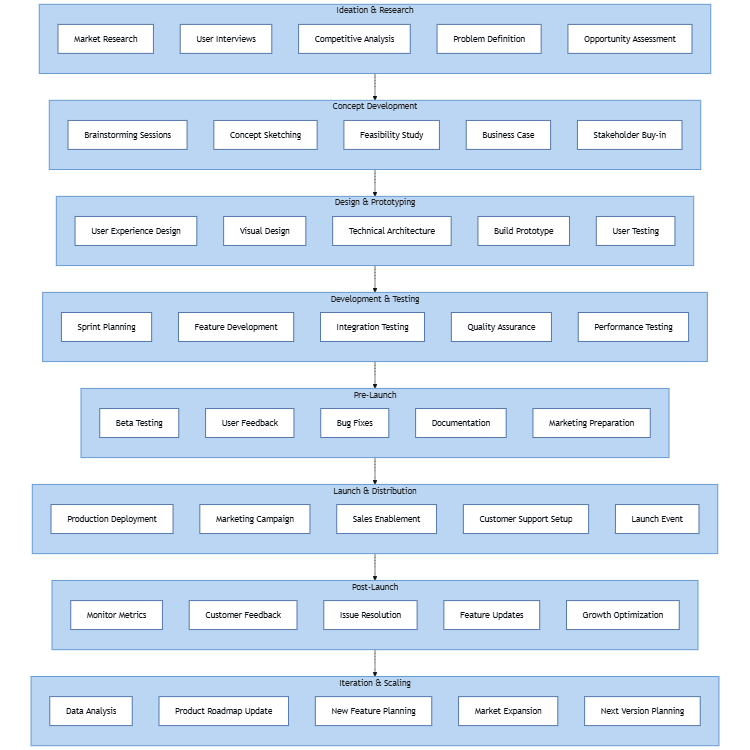
Product Development Lifecycle
Comprehensive vertical product development process from ideation to market launch and iteration

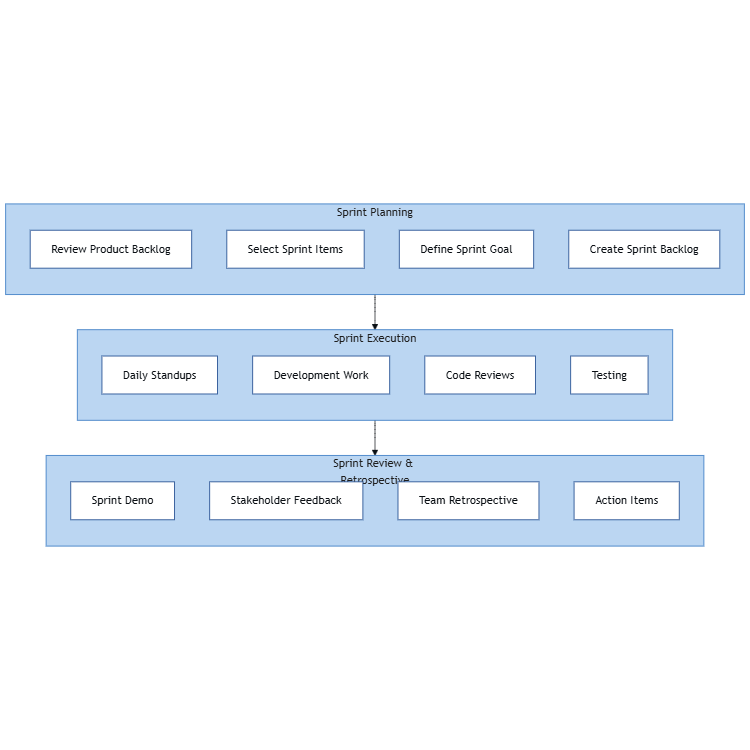
Agile Sprint Process
Vertical planning flow for agile sprint from planning to retrospective

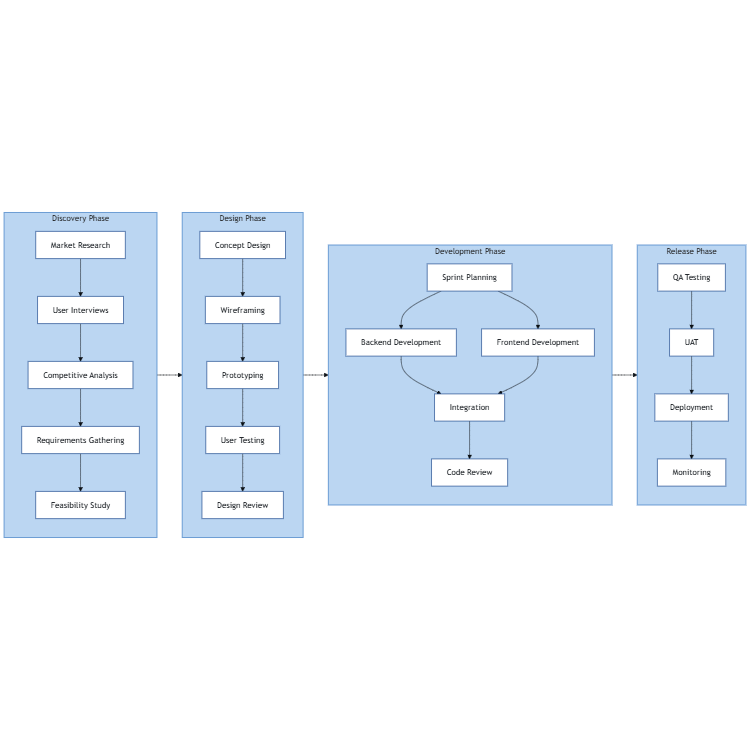
Product Development Pipeline
Moderate complexity horizontal workflow for product development lifecycle

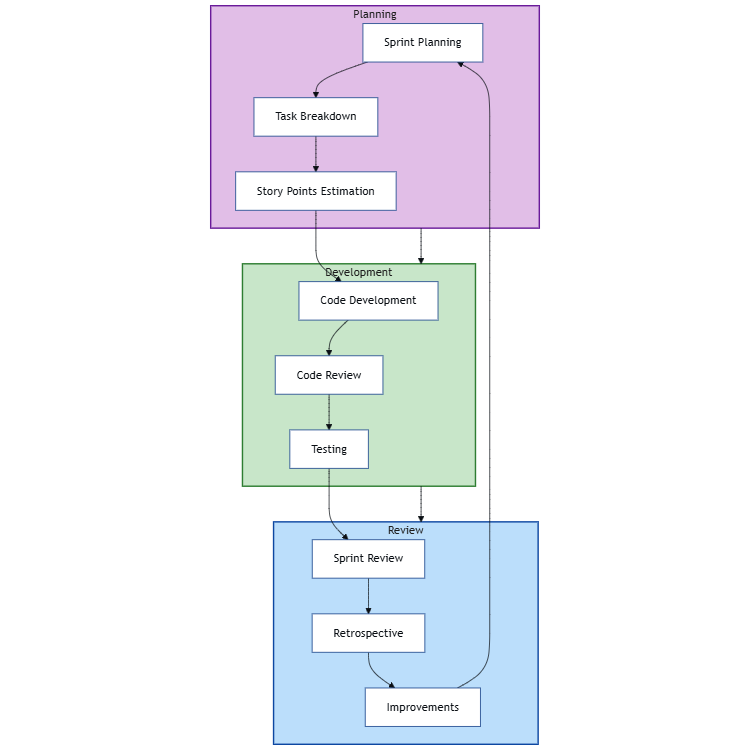
Agile Sprint Cycle
Simple agile sprint cycle with colored subgraphs

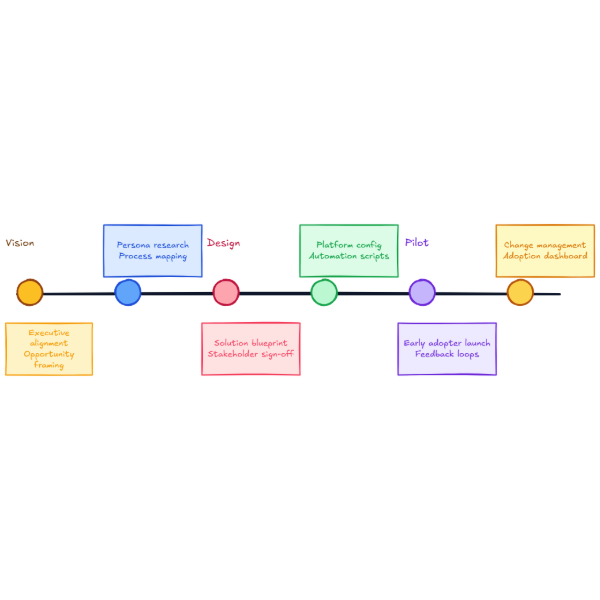
Transformation Milestone Track
Milestone track showing initiative themes, owners, and handoffs across six phases.

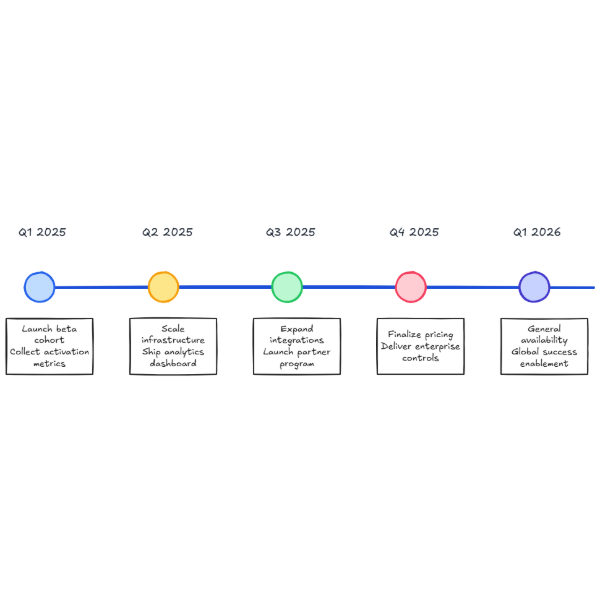
Product Roadmap Timeline
Quarterly roadmap timeline with milestones, key deliverables, and status callouts.

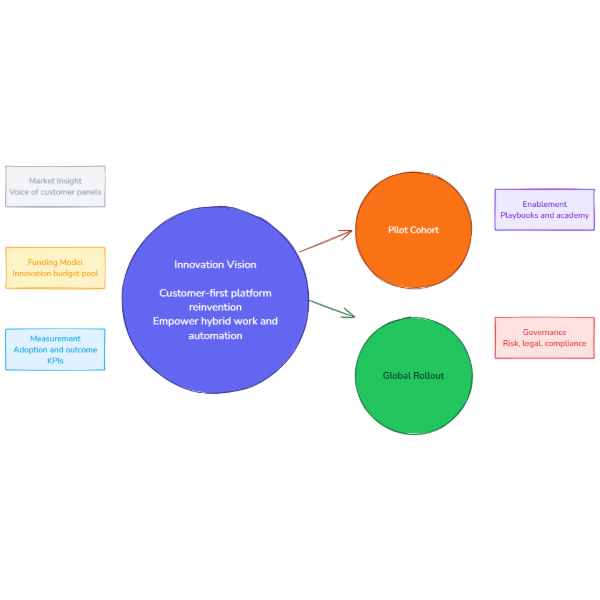
Innovation Initiative Map
Core circle summarizing innovation vision with supporting pilots and rollout pillars.

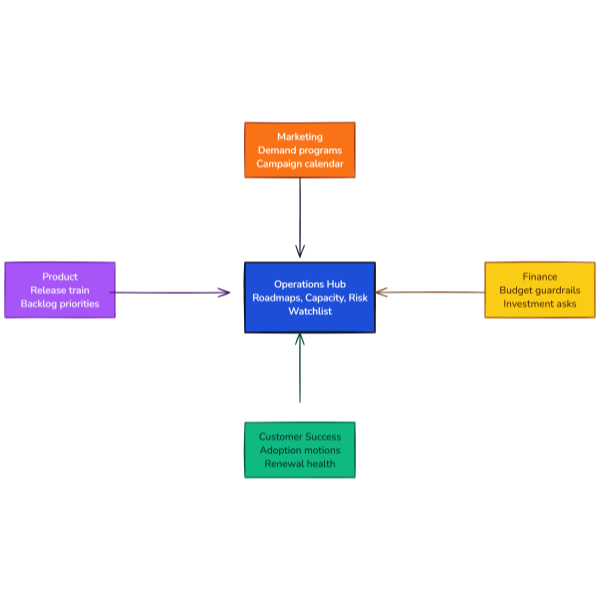
Operations Collaboration Hub
Central operations hub linking marketing, product, success, and finance priorities.

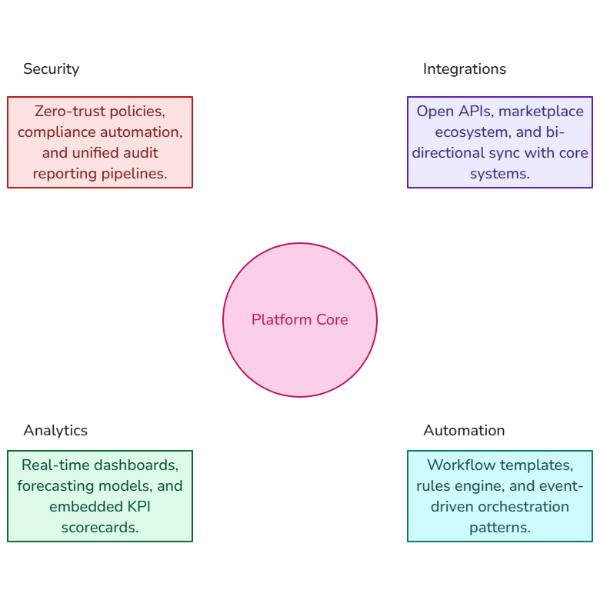
SaaS Platform Capability Map
Core platform circle linking security, integrations, analytics, and automation priorities.

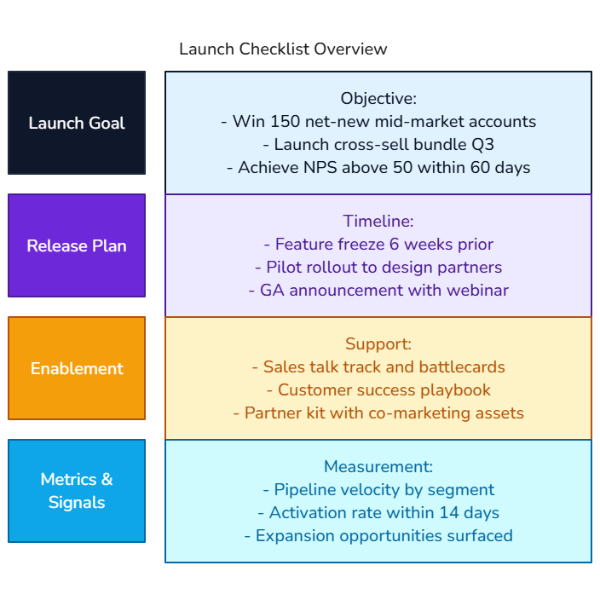
Product Launch Briefing Cards
Cards aligning launch goals, release checklist, enablement deliverables, and key metrics.

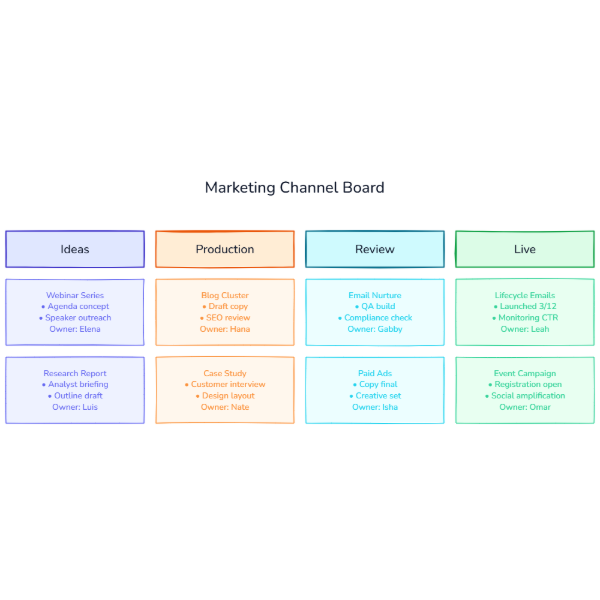
Marketing Workflow Kanban
Marketing kanban board featuring ideas, production, review, and live campaign columns.

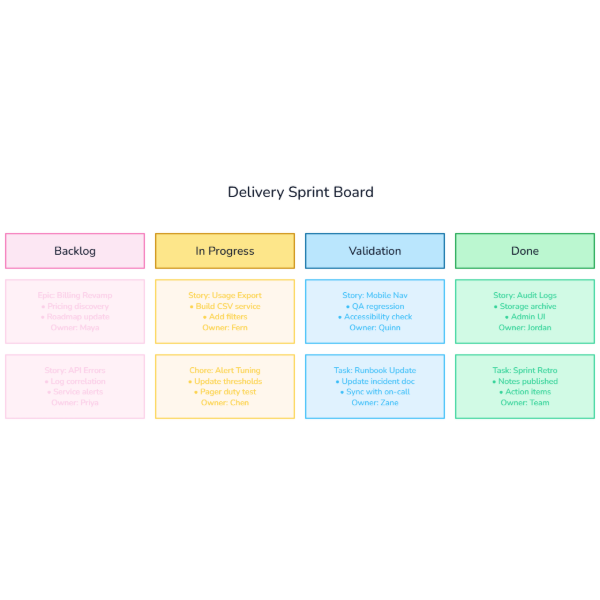
Team Delivery Kanban
Four-column delivery kanban with backlog, in progress, validation, and done swimlanes.

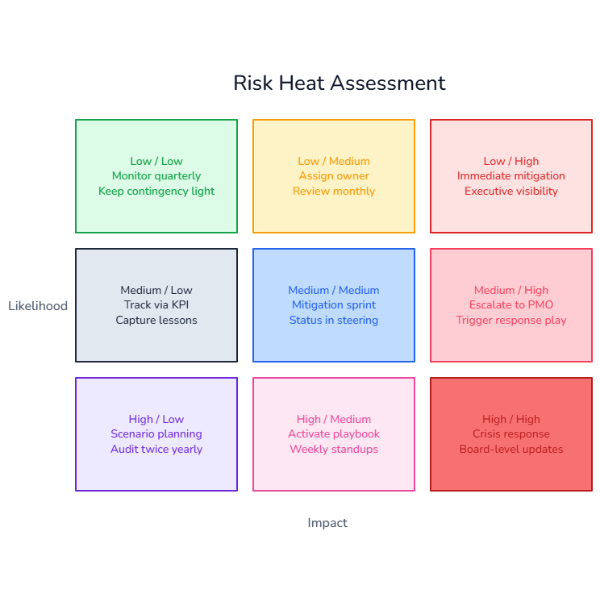
Risk Heat Matrix
3x3 risk heat matrix evaluating likelihood versus impact categories with guidance.

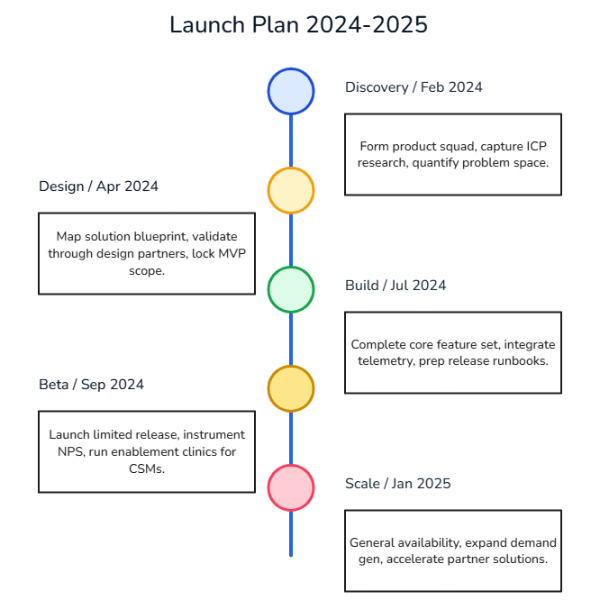
Product Launch Timeline
Vertical launch timeline plotting discovery through scale milestones with brief callouts.

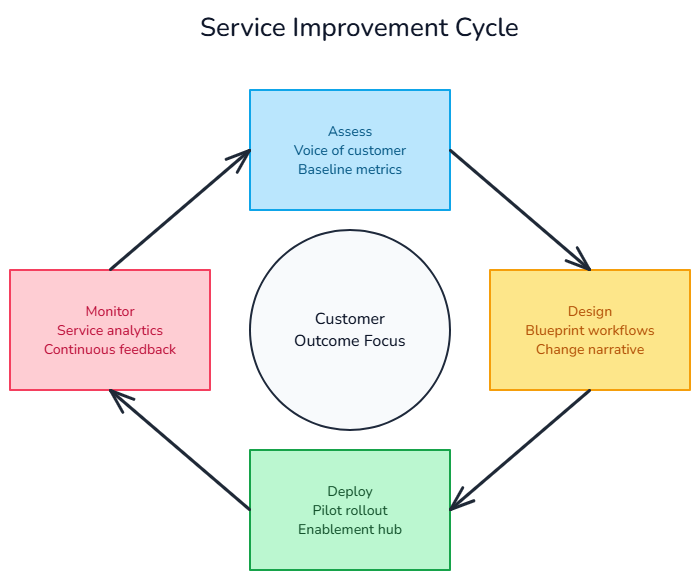
Service Improvement Cycle
Four-stage cycle mapping assess, design, deploy, and monitor service improvements.

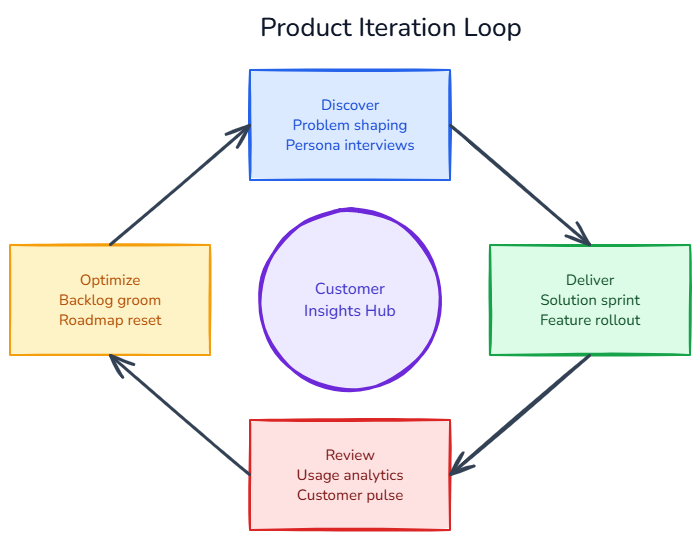
Product Iteration Cycle
Four-step cycle highlighting discovery, delivery, review, and optimization loops.

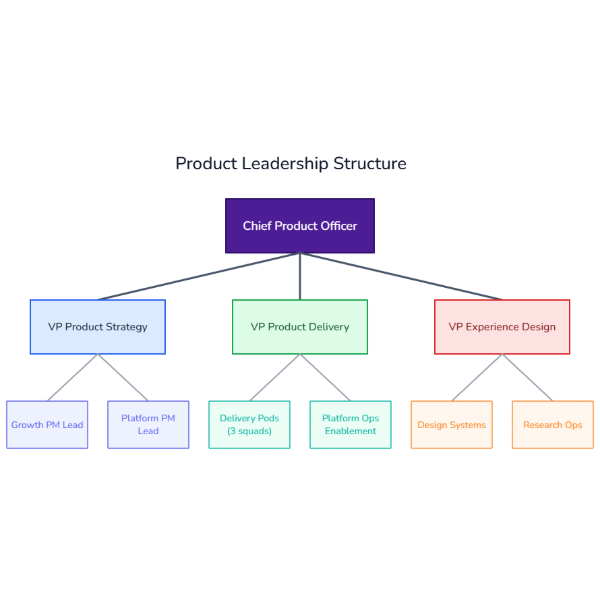
Product Leadership Org
Three-tier product leadership hierarchy showing executives, leads, and squads.

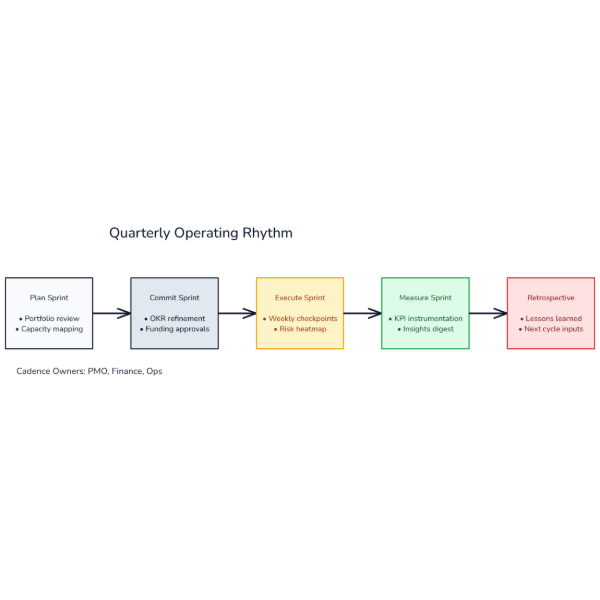
Operating Rhythm Flow
Horizontal cadence flow outlining quarterly planning, execution, and review cycles.

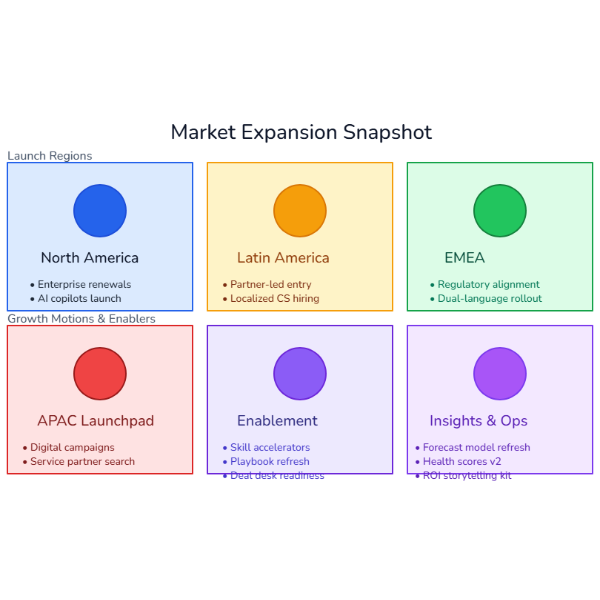
Market Expansion Snapshot
2x3 market snapshot framing launch regions, motions, and supporting enablers.

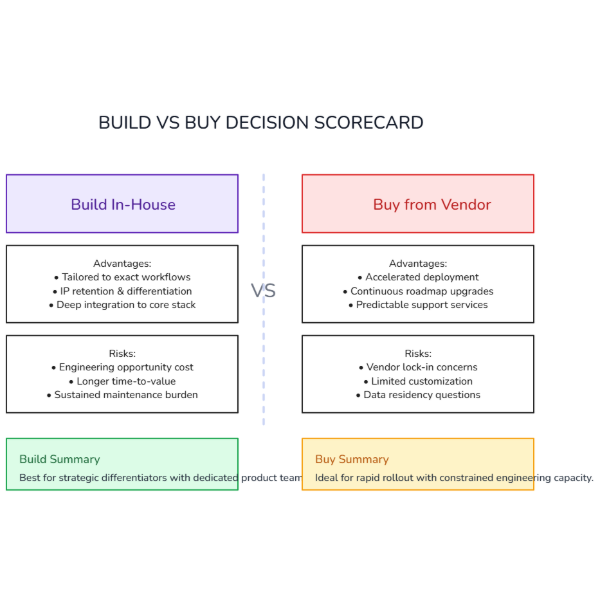
Build vs Buy Analysis
Comparison layout highlighting build versus buy decision drivers and guidance.

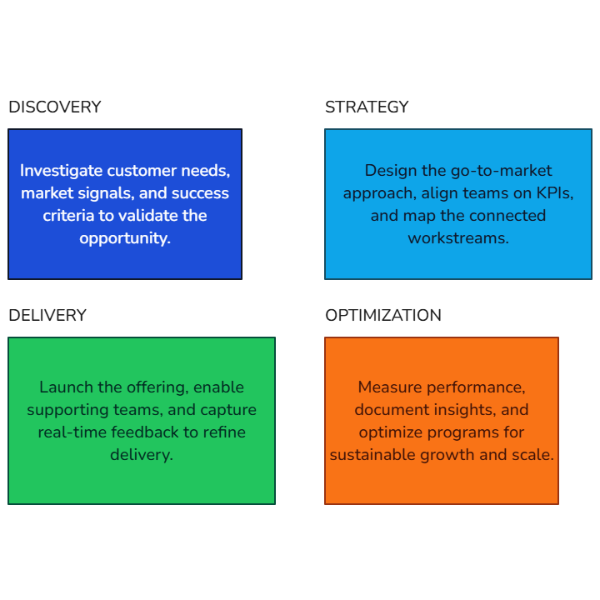
Service Launch Playbook
Discovery-to-optimization playbook for launching a new service with clear activities and ownership expectations.

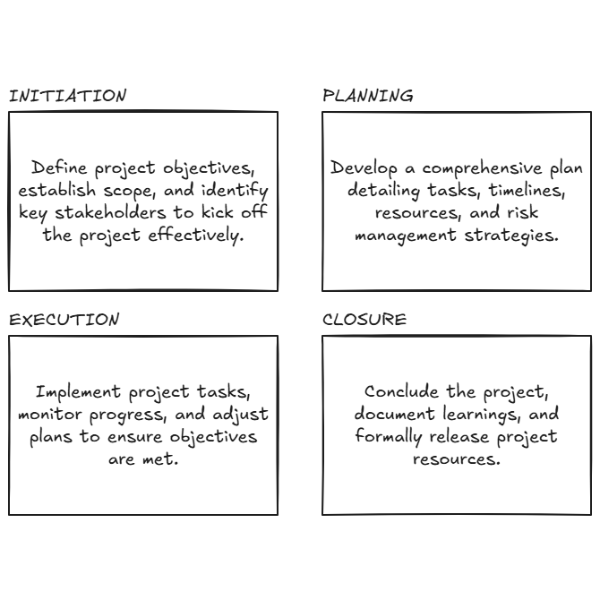
Project Delivery Lifecycle
Four-phase project delivery layout that highlights initiation, planning, execution, and closure milestones.

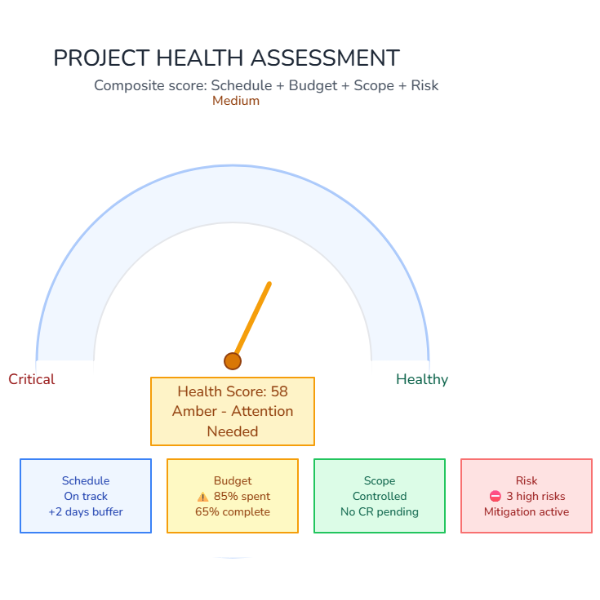
Project Health Score
Semi-circular gauge dial showing overall project health assessment based on schedule, budget, scope, and risk metrics

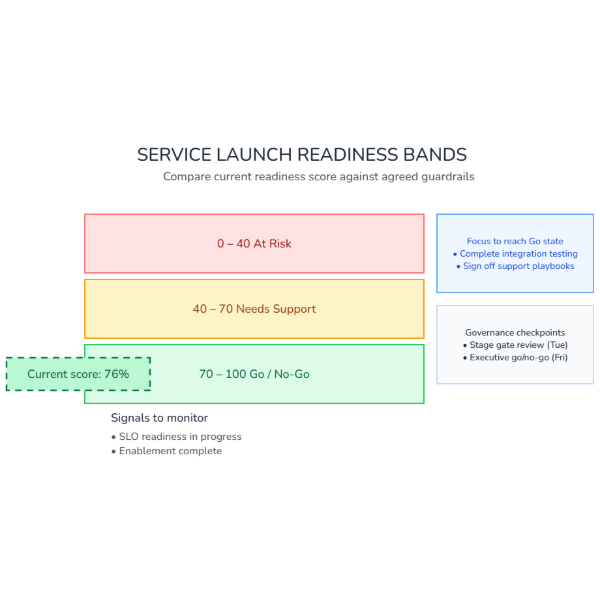
Service Launch Readiness Bands
Track launch readiness across risk, support, and go-live criteria using color-coded assessment bands.
