Diagram Template Gallery
Browse professional diagram templates and instantly generate customized diagrams with AI. Simply select a template and let Diagramming AI transform it into your perfect diagram in seconds.
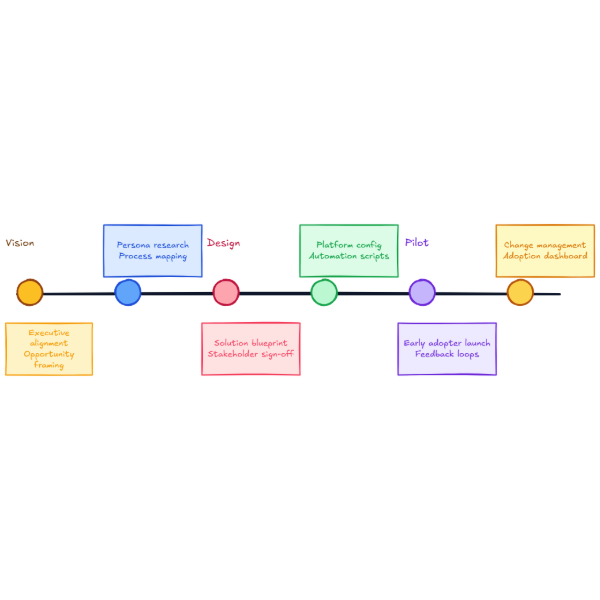
Transformation Milestone Track
Milestone track showing initiative themes, owners, and handoffs across six phases.

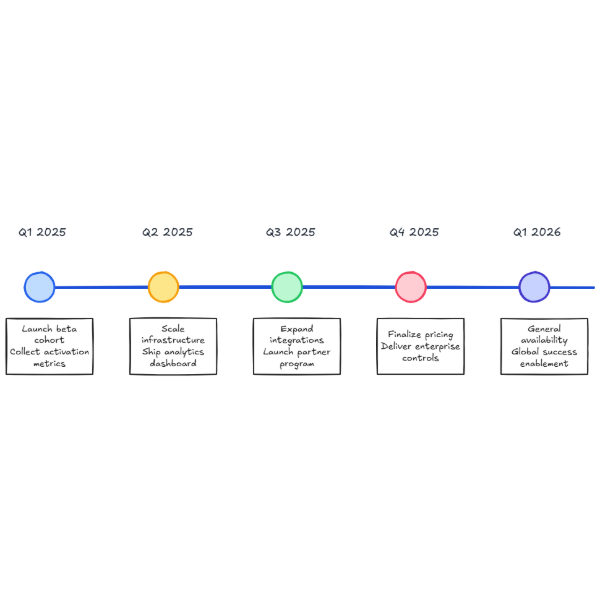
Product Roadmap Timeline
Quarterly roadmap timeline with milestones, key deliverables, and status callouts.

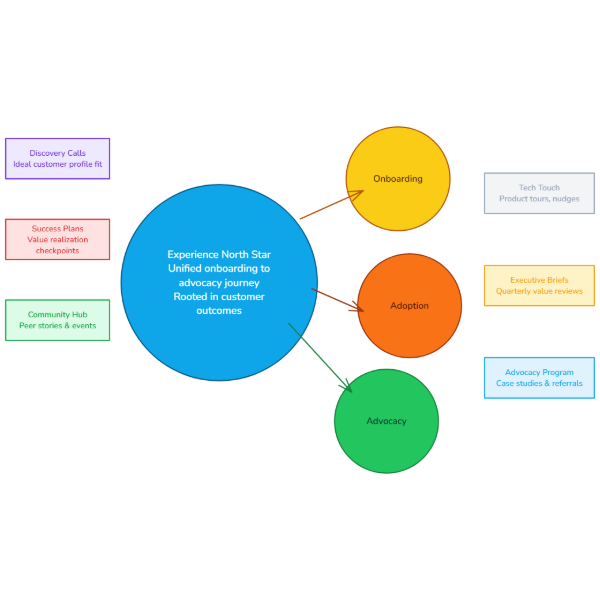
Customer Journey Spotlight
Experience spotlight linking onboarding, adoption, and advocacy touchpoints.

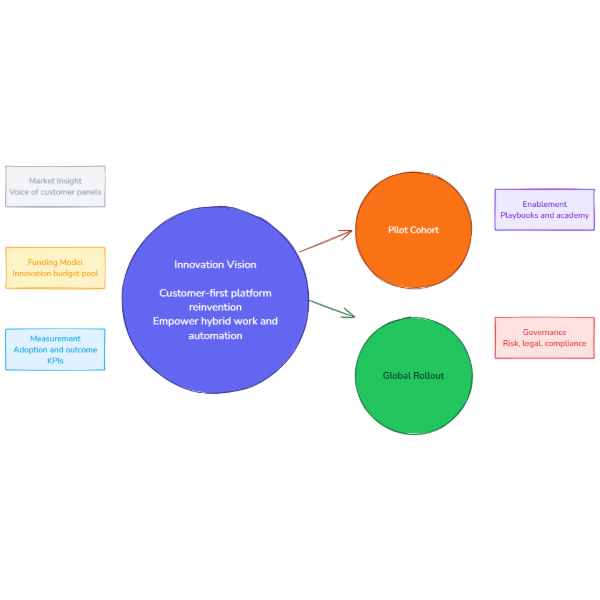
Innovation Initiative Map
Core circle summarizing innovation vision with supporting pilots and rollout pillars.

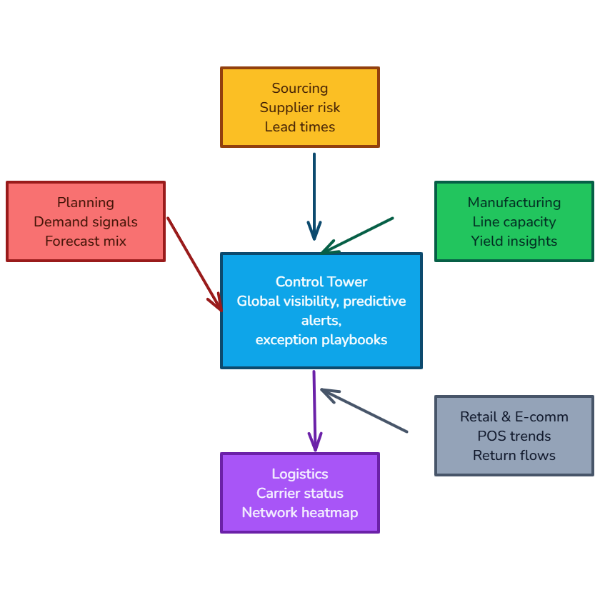
Supply Chain Control Tower
Control tower layout aligning sourcing, manufacturing, logistics, and retail signals.

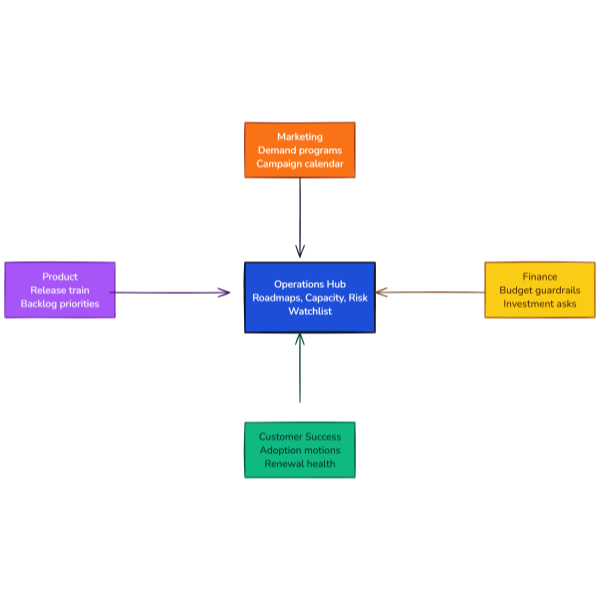
Operations Collaboration Hub
Central operations hub linking marketing, product, success, and finance priorities.

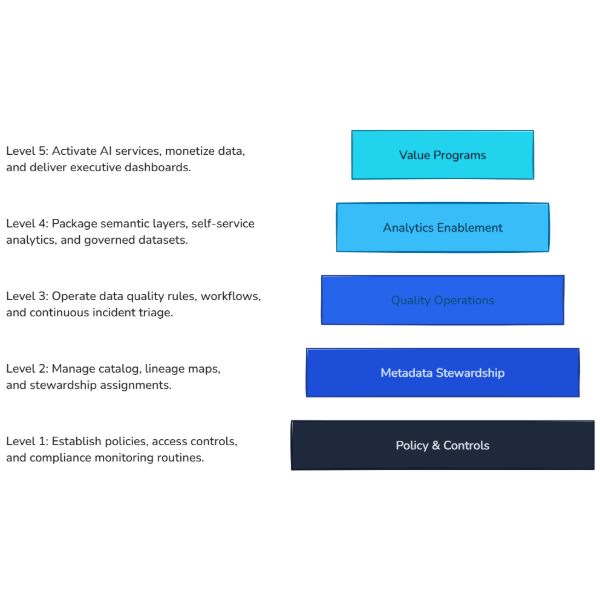
Data Governance Maturity Pyramid
Pyramid showing data governance maturity from policy foundations to value programs.

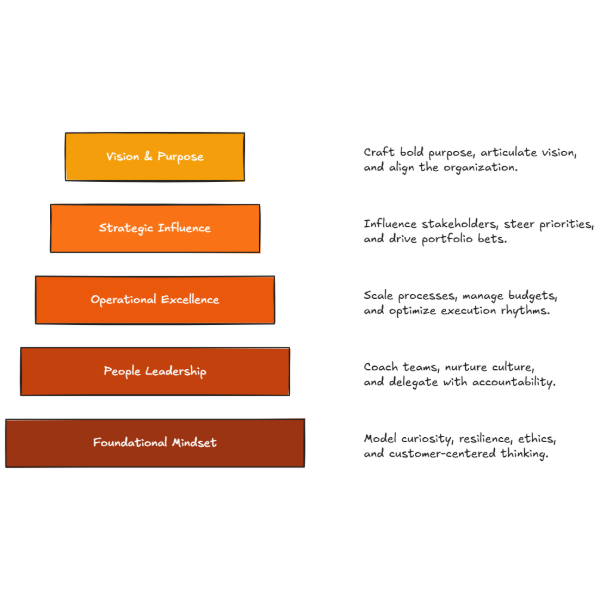
Leadership Capability Pyramid
Leadership pyramid spanning vision, influence, operational excellence, and culture.

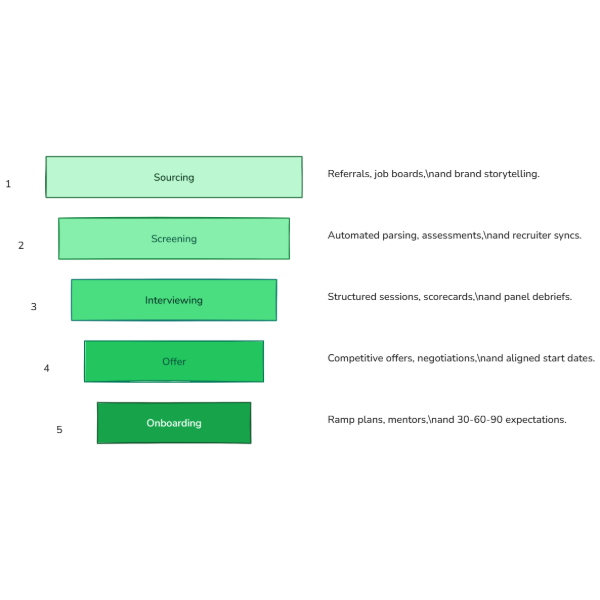
Talent Acquisition Funnel
Recruiting funnel covering sourcing, screening, interviews, offers, and onboarding.

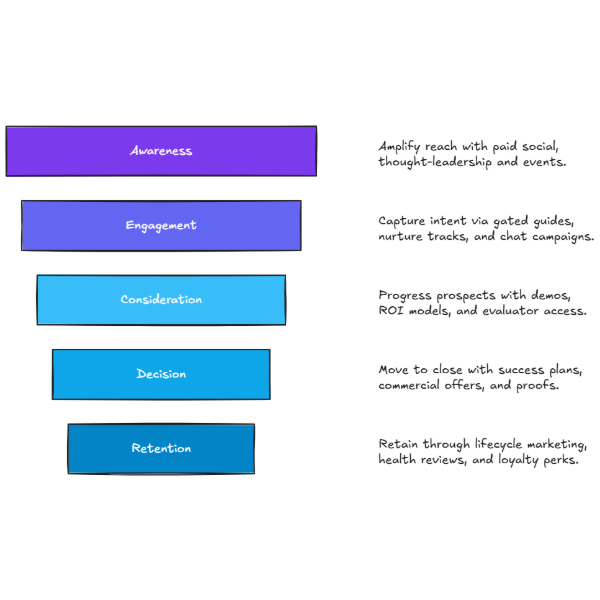
Demand Generation Funnel
Five-stage marketing funnel outlining awareness to retention tactics for B2B demand gen.

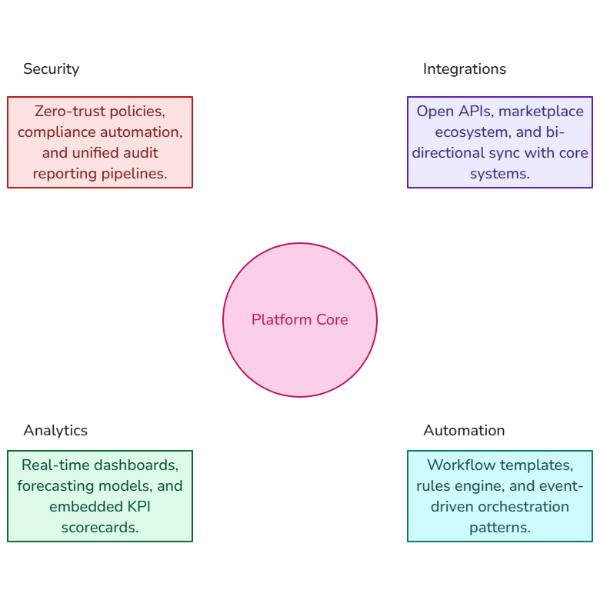
SaaS Platform Capability Map
Core platform circle linking security, integrations, analytics, and automation priorities.

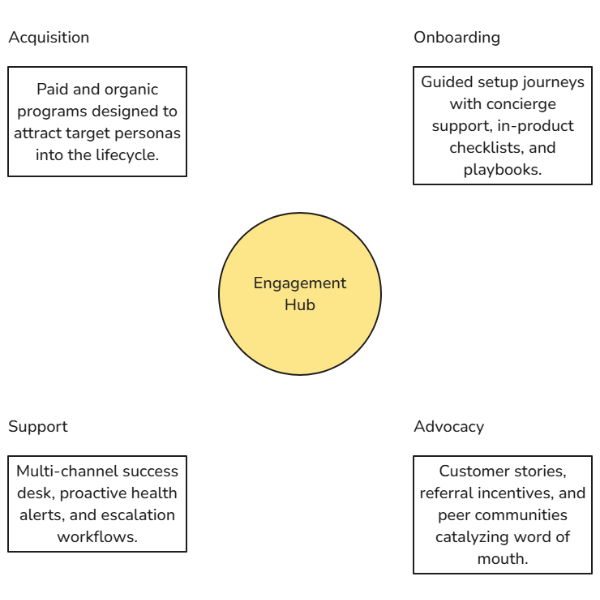
Customer Engagement Hub
Center hub diagram connecting acquisition, onboarding, support, and advocacy workflows.

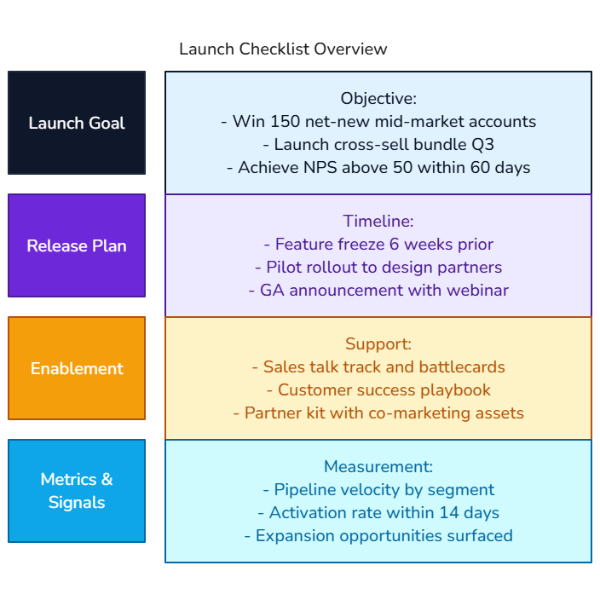
Product Launch Briefing Cards
Cards aligning launch goals, release checklist, enablement deliverables, and key metrics.

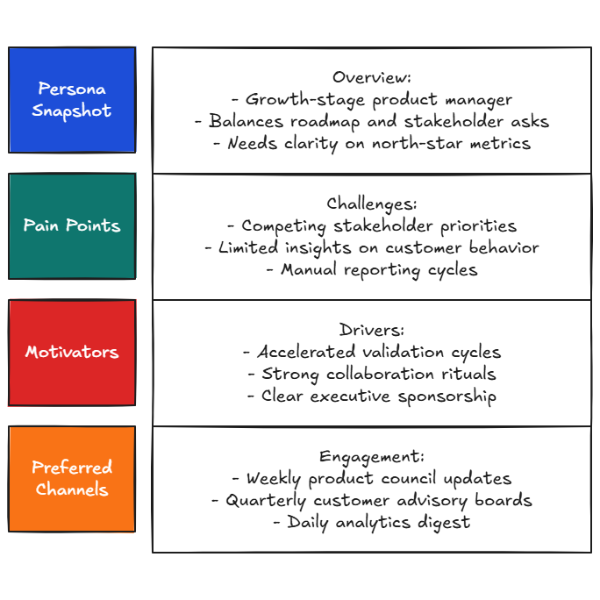
Customer Persona Highlights
Persona briefing cards outlining snapshot, pain points, motivators, and outreach tactics.

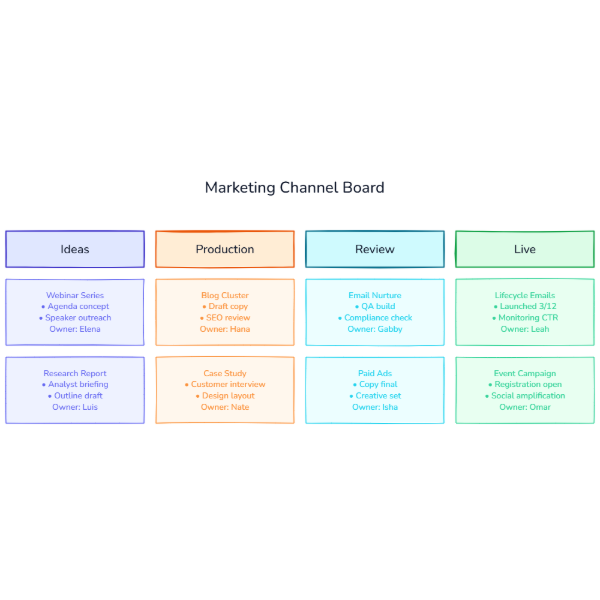
Marketing Workflow Kanban
Marketing kanban board featuring ideas, production, review, and live campaign columns.

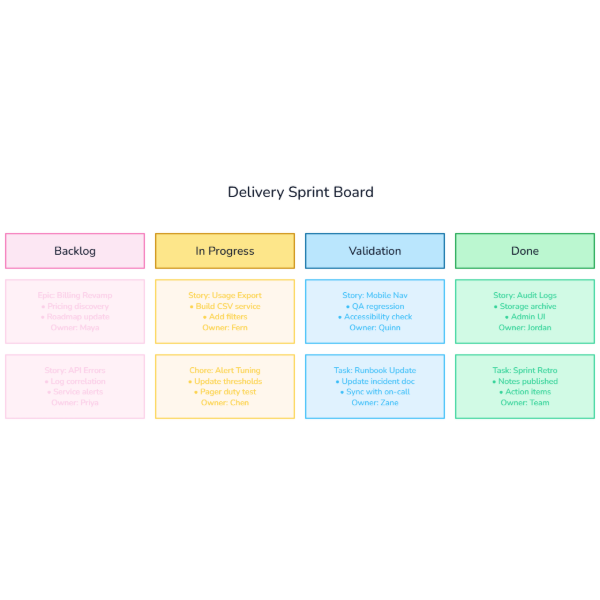
Team Delivery Kanban
Four-column delivery kanban with backlog, in progress, validation, and done swimlanes.

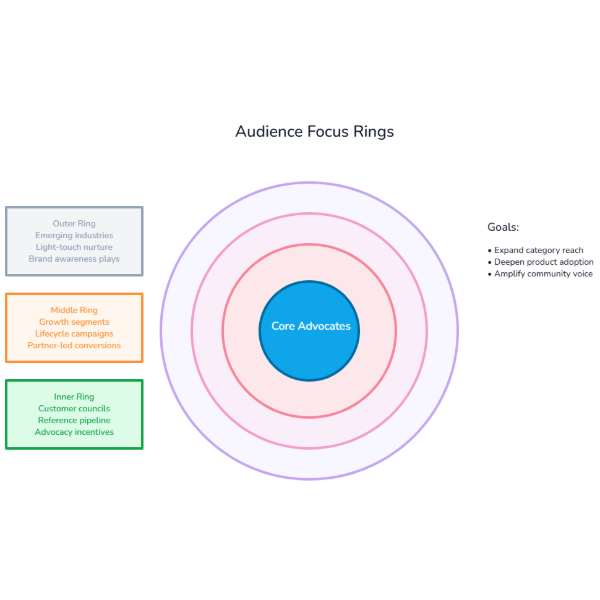
Customer Segment Target
Concentric segment target separating core advocates, growth segments, and fringe audiences.

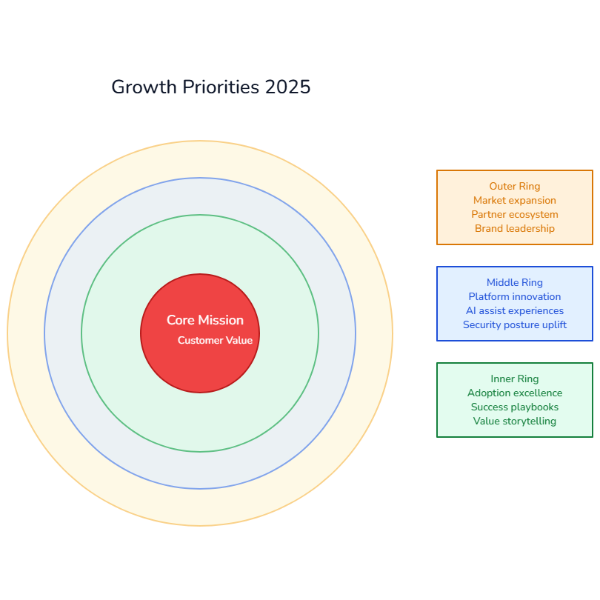
Growth Priority Target
Concentric priority target outlining vision, strategic themes, and tactical focus rings.

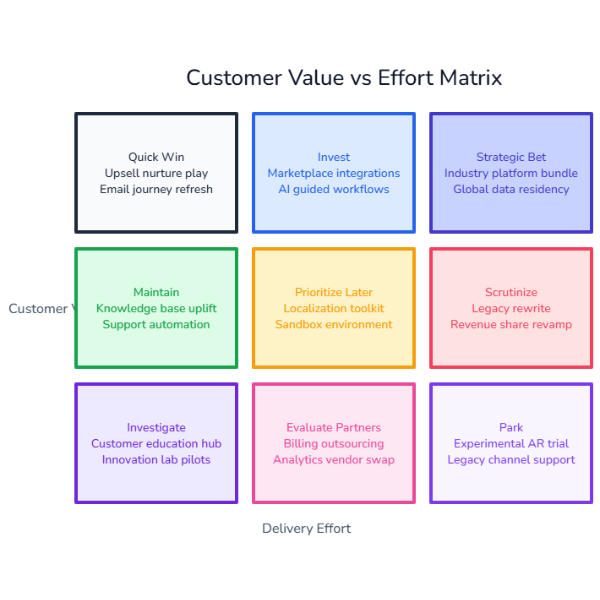
Opportunity Prioritization Grid
3x3 opportunity matrix scoring initiatives across customer value and effort bands.

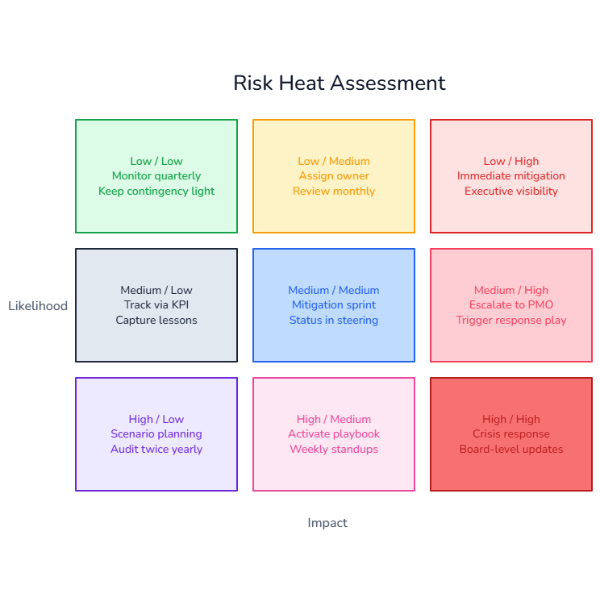
Risk Heat Matrix
3x3 risk heat matrix evaluating likelihood versus impact categories with guidance.

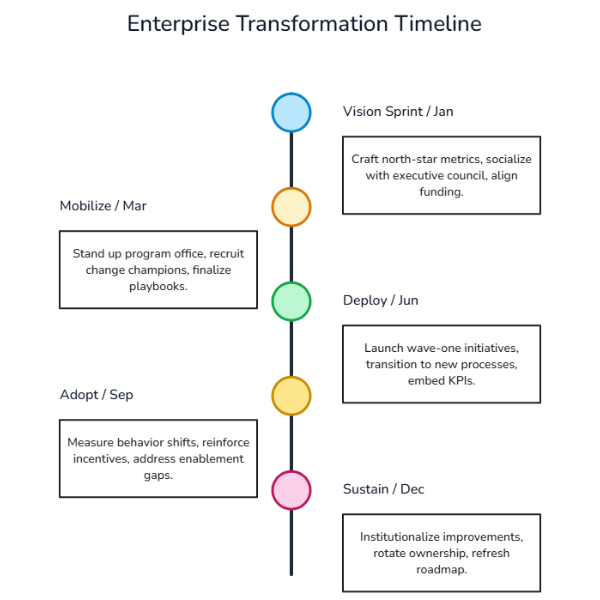
Transformation Vertical Timeline
Vertical transformation timeline charting vision through sustain phases with alternating notes.

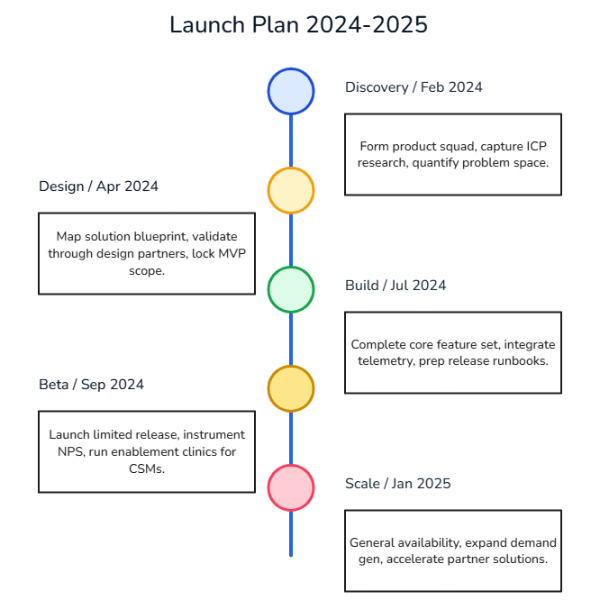
Product Launch Timeline
Vertical launch timeline plotting discovery through scale milestones with brief callouts.

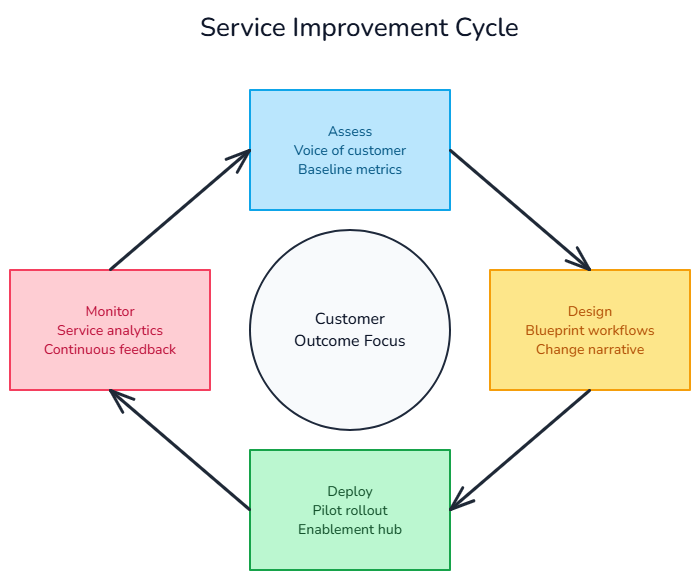
Service Improvement Cycle
Four-stage cycle mapping assess, design, deploy, and monitor service improvements.

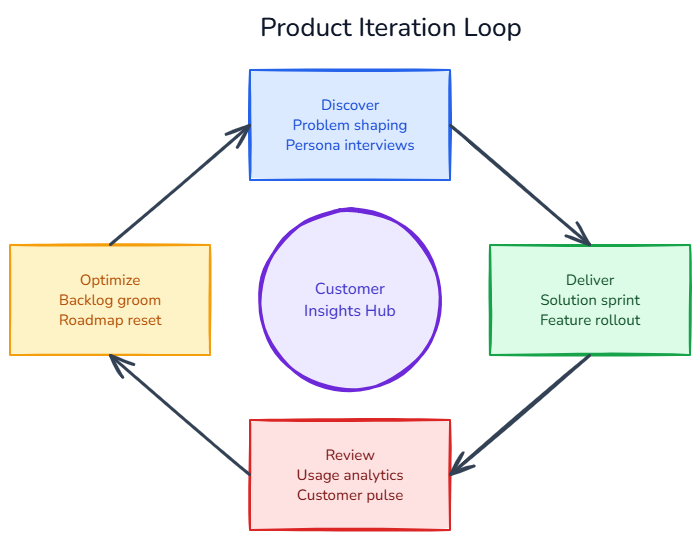
Product Iteration Cycle
Four-step cycle highlighting discovery, delivery, review, and optimization loops.

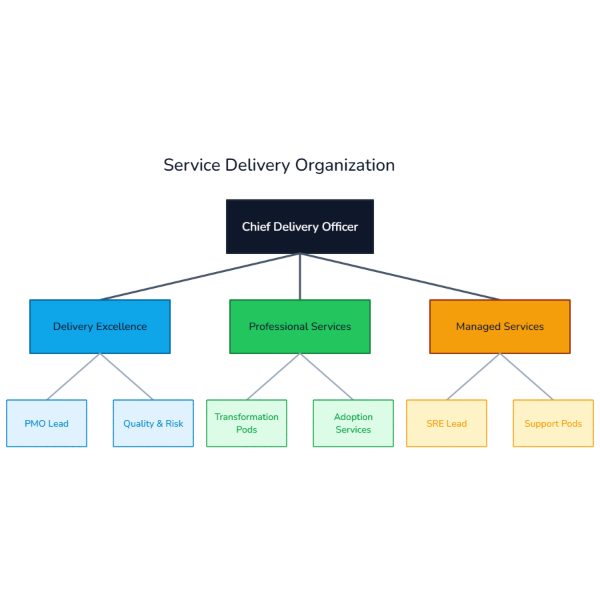
Service Delivery Org
Multi-level service delivery hierarchy connecting leaders, practice owners, and pods.

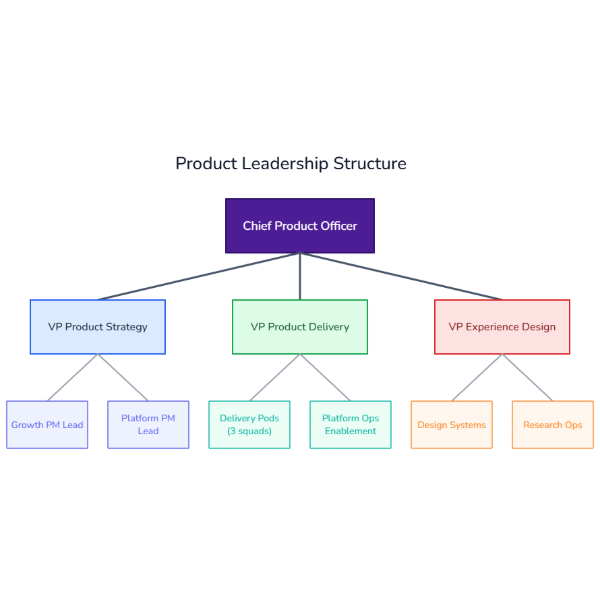
Product Leadership Org
Three-tier product leadership hierarchy showing executives, leads, and squads.

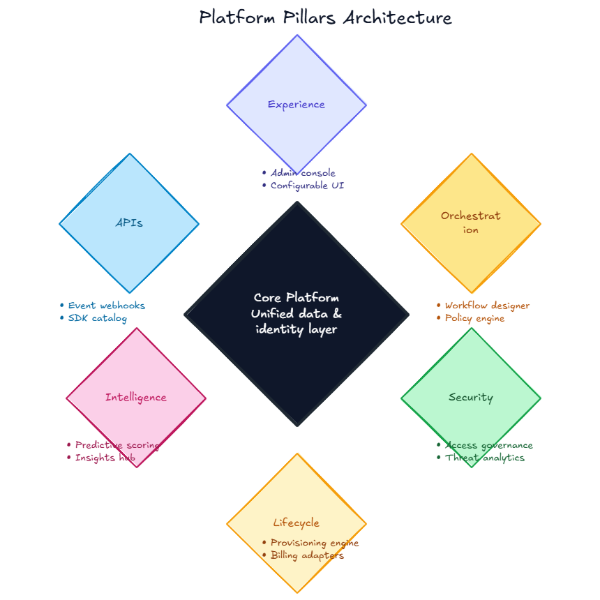
Platform Pillars Hexagon
Hexagon diagram framing platform core with six supporting capability pillars.

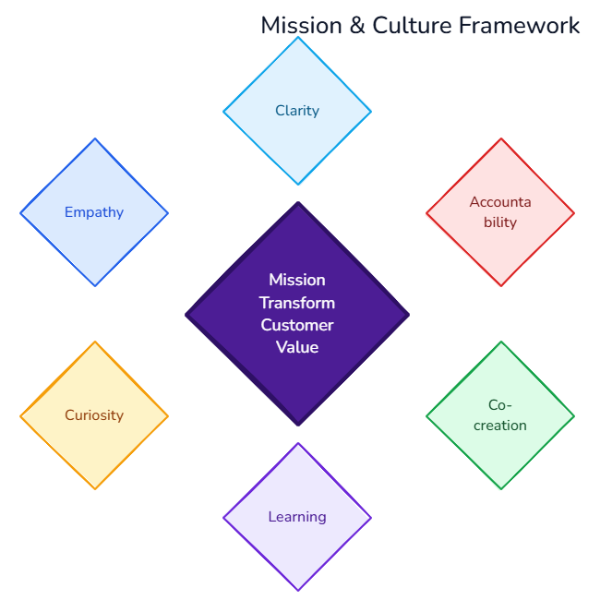
Culture Values Hexagon
Hexagon layout mapping central mission with six cultural pillars around it.

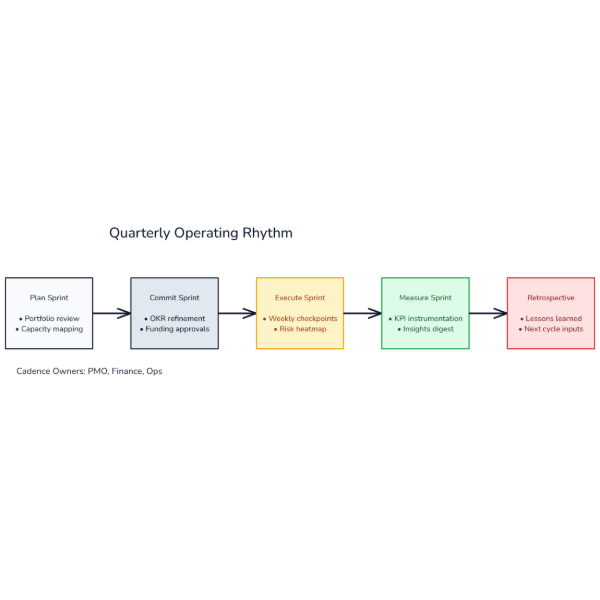
Operating Rhythm Flow
Horizontal cadence flow outlining quarterly planning, execution, and review cycles.

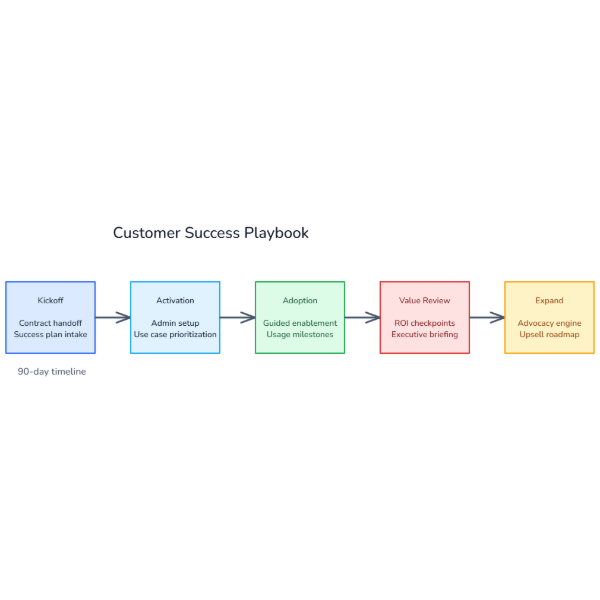
Customer Success Flow
Horizontal playbook illustrating onboarding, adoption, and value review milestones.

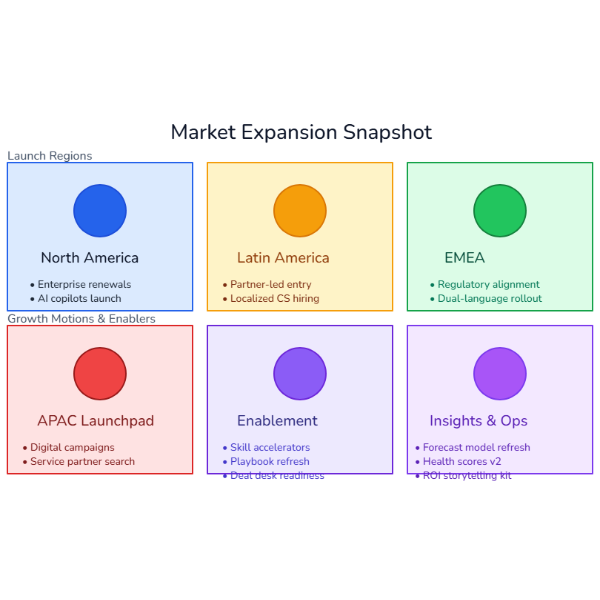
Market Expansion Snapshot
2x3 market snapshot framing launch regions, motions, and supporting enablers.

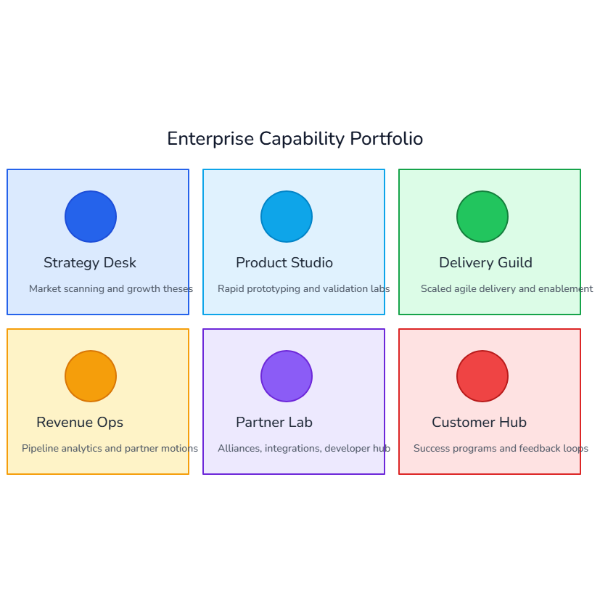
Capability Portfolio Grid
2x3 capability grid highlighting core services, enablers, and support offerings.

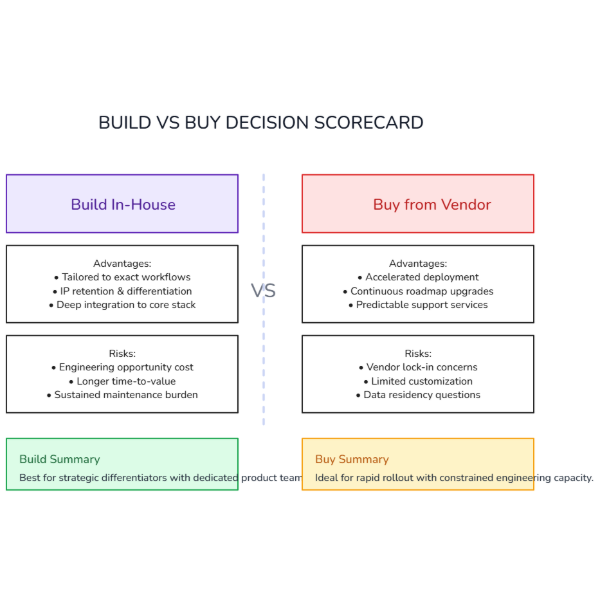
Build vs Buy Analysis
Comparison layout highlighting build versus buy decision drivers and guidance.

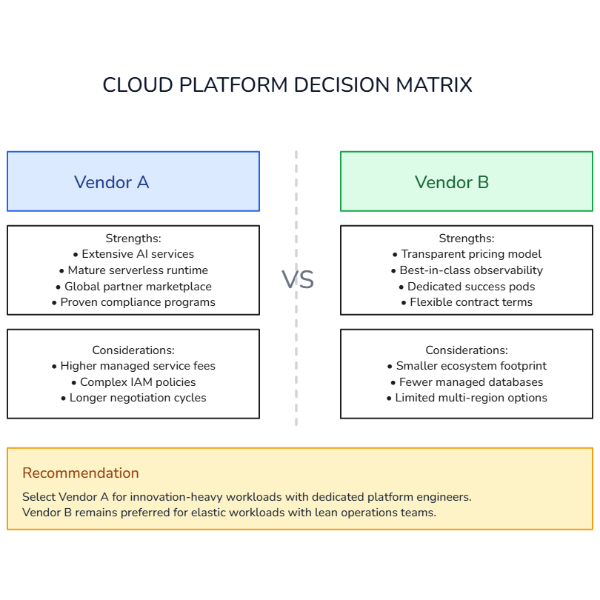
Cloud Vendor Comparison
Side-by-side comparison of two cloud vendors with benefits and tradeoffs.

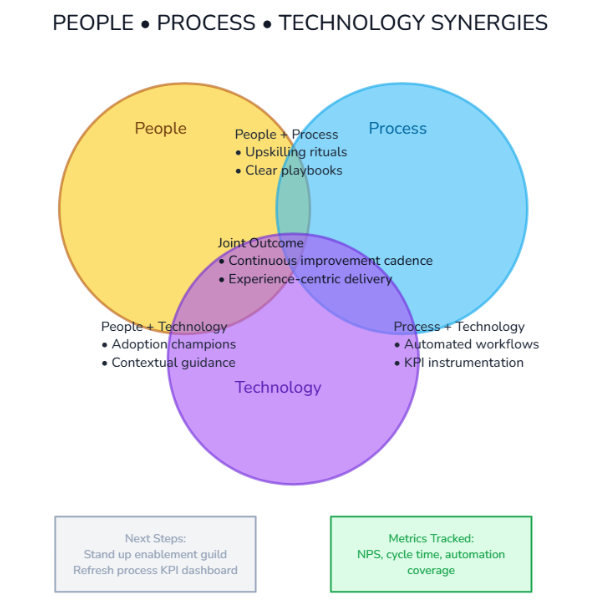
Operating Model Synergy Venn
Three-circle Venn linking people, process, and technology synergies with joint outcomes.

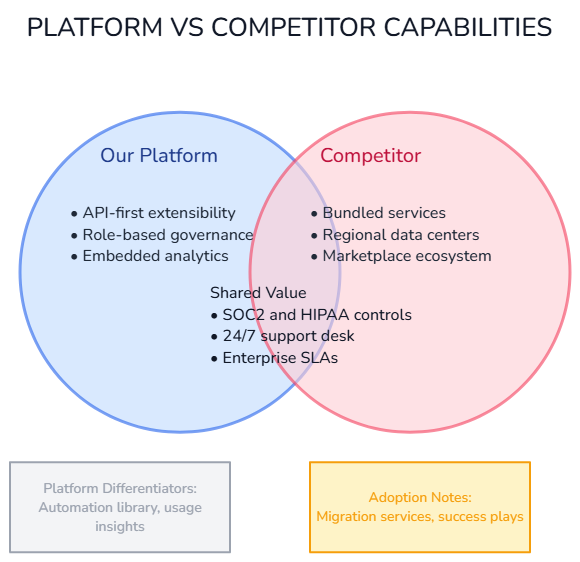
Feature Overlap Venn
Two-circle Venn comparing platform versus competitor features with shared capabilities.

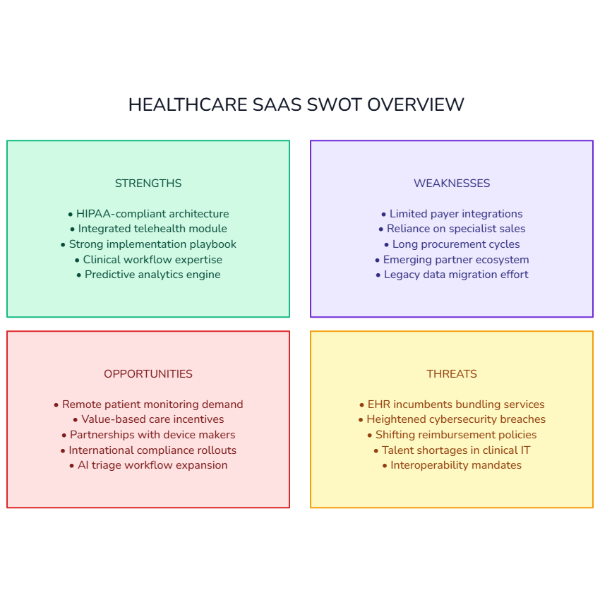
Healthcare SaaS SWOT Grid
SWOT grid outlining healthcare SaaS strengths, weaknesses, opportunities, and threats.

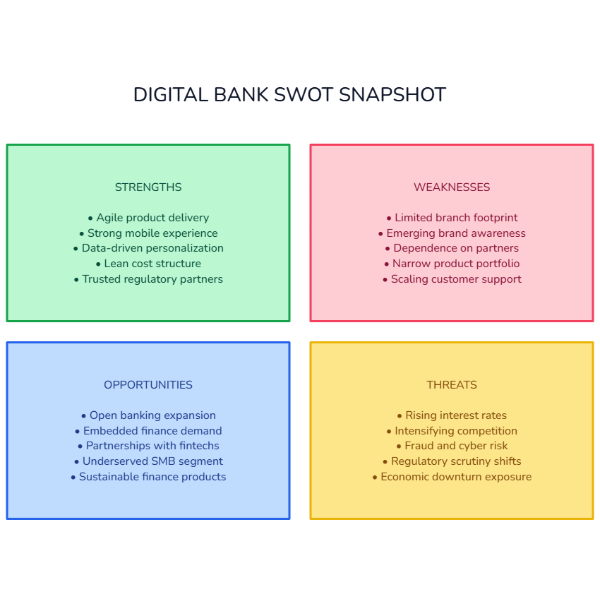
Digital Bank SWOT Matrix
SWOT matrix summarizing digital bank strengths, weaknesses, opportunities, and threats.

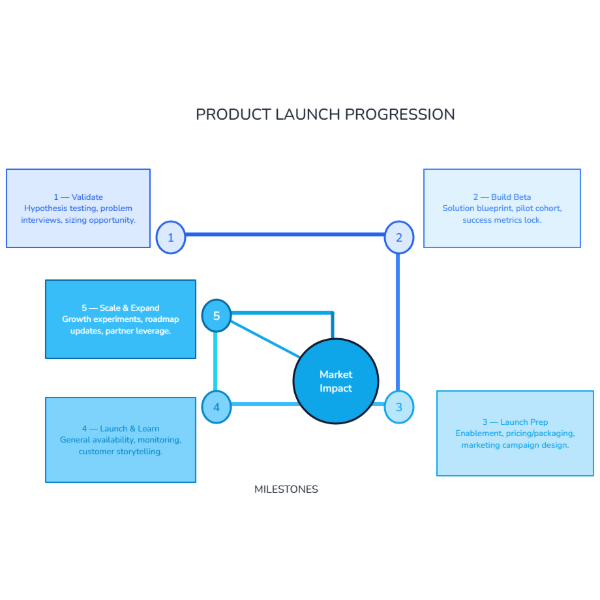
Product Launch Spiral
Spiral progression path that illustrates the iterative phases of a product launch converging on a market impact goal.

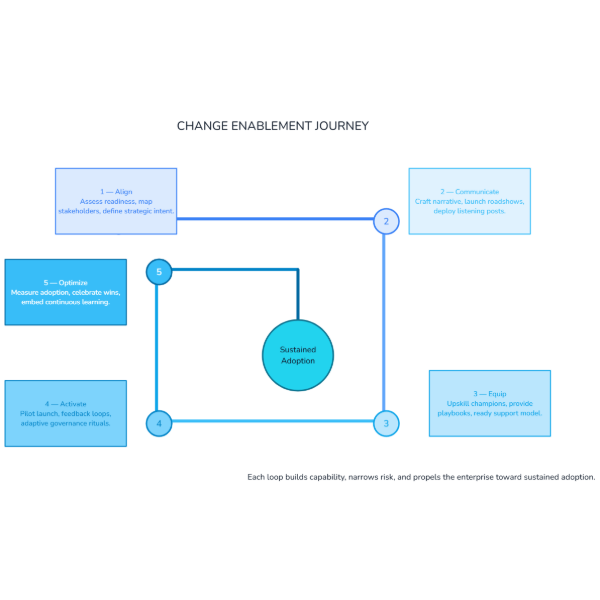
Change Enablement Spiral
Spiral progression path that visualizes a five-phase change enablement program converging on the desired outcome.

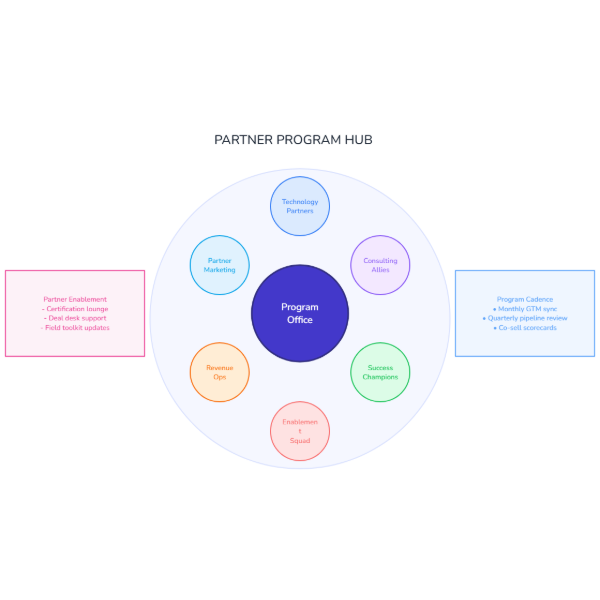
Partner Program Spokes
Hub-and-spoke cluster showing partner program roles, enablement pillars, and governance notes around the platform.

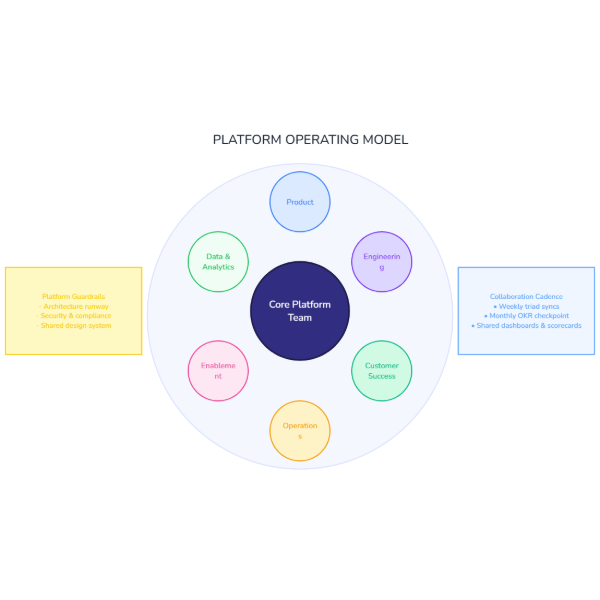
Platform Operating Model Map
Radial spoke cluster showing the core platform team and six surrounding functions aligned to the operating model.

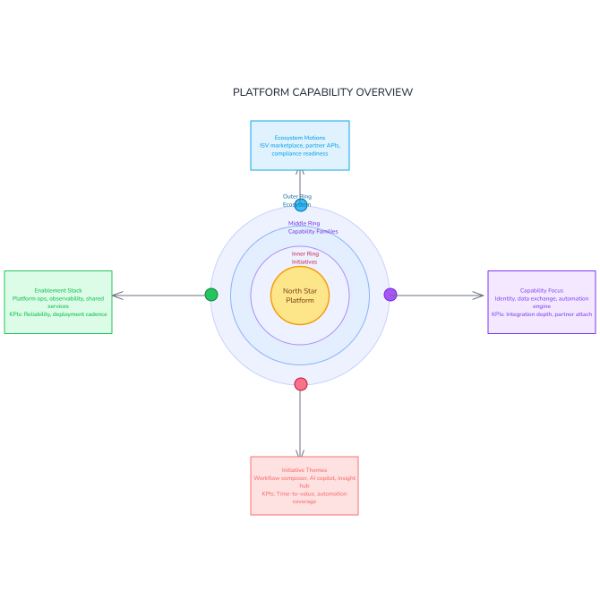
Platform Capability Sunburst
Sunburst visualization that layers platform capabilities from strategic themes to enabling initiatives and core vision.

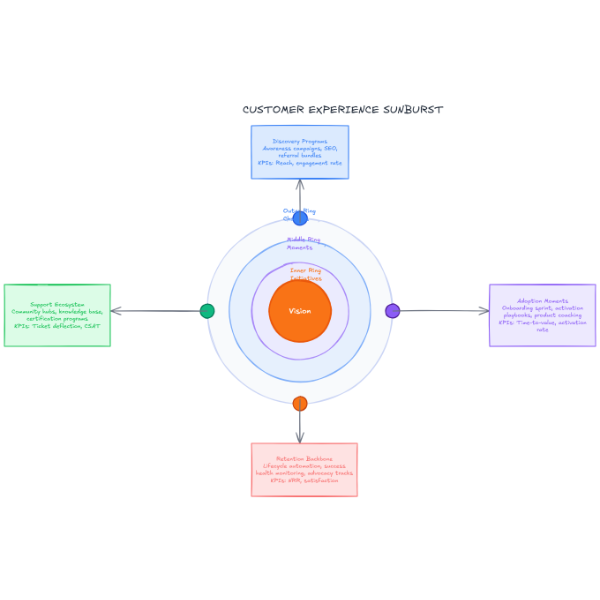
Customer Journey Sunburst
Sunburst hierarchy that maps customer journey layers from channel moments through core initiatives and vision.

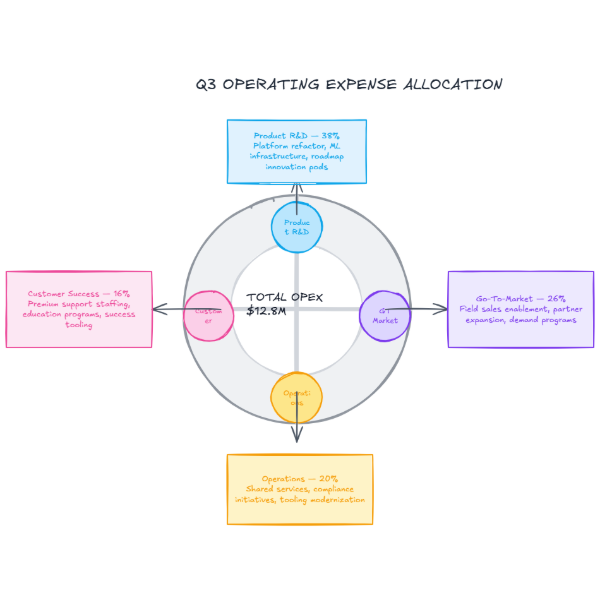
Finance Allocation Donut
Segmented donut breakdown that communicates quarterly operating spend across strategic investment themes.

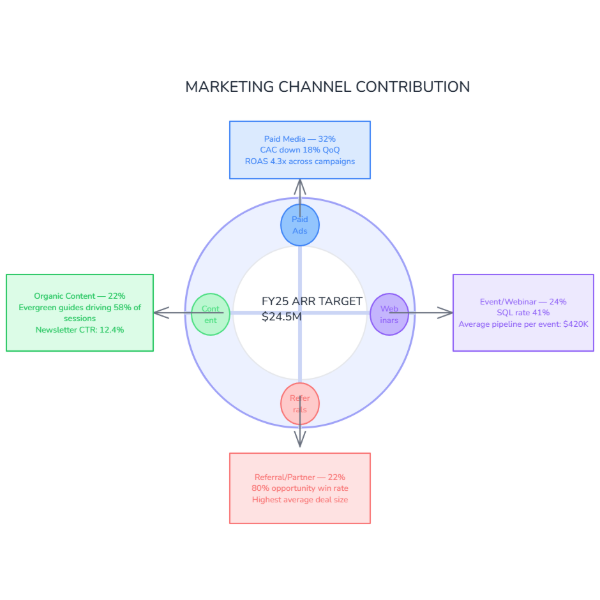
Channel Mix Performance Donut
Segmented donut visualization that highlights marketing channel contribution, conversion quality, and revenue impact.

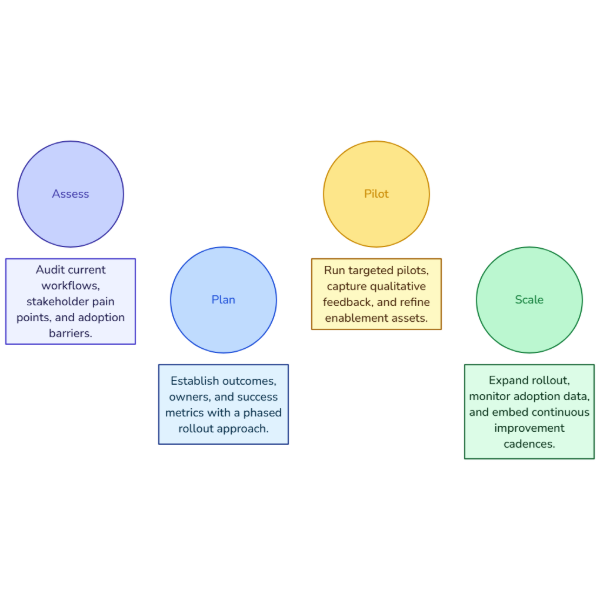
Change Adoption Cycle
Assess-plan-pilot-scale framework for guiding organizational change with clear interventions at each stage.

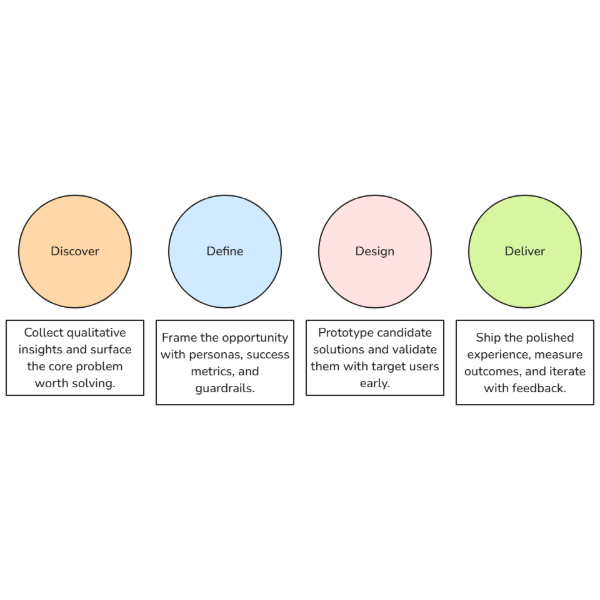
Design Thinking Loop
Discover-define-design-deliver workflow summarizing an iterative design thinking cycle for product teams.

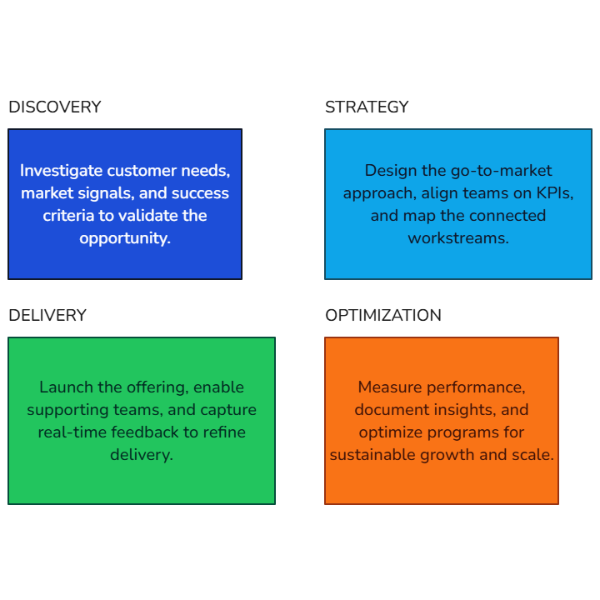
Service Launch Playbook
Discovery-to-optimization playbook for launching a new service with clear activities and ownership expectations.

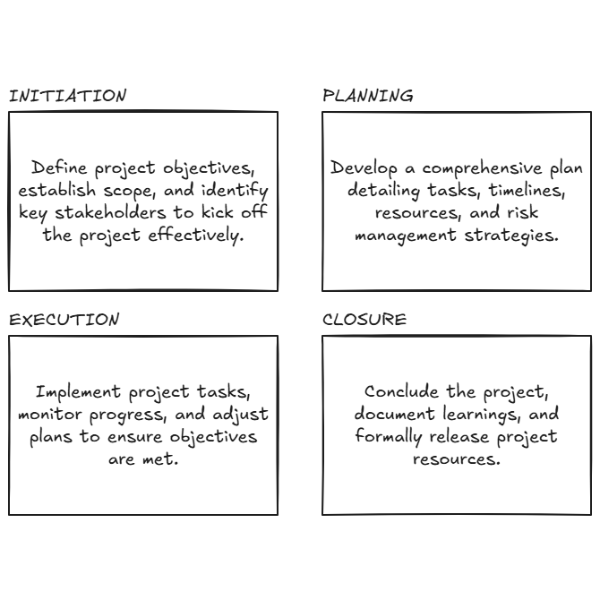
Project Delivery Lifecycle
Four-phase project delivery layout that highlights initiation, planning, execution, and closure milestones.
