Diagram Template Gallery
Browse professional diagram templates and instantly generate customized diagrams with AI. Simply select a template and let Diagramming AI transform it into your perfect diagram in seconds.
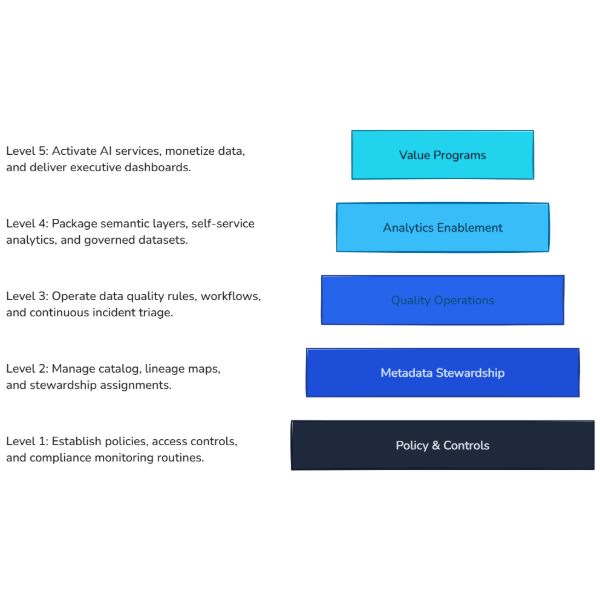
Data Governance Maturity Pyramid
Pyramid showing data governance maturity from policy foundations to value programs.

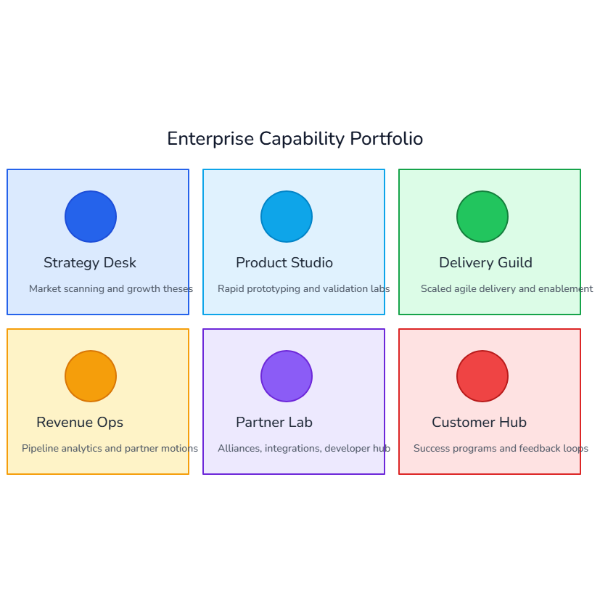
Capability Portfolio Grid
2x3 capability grid highlighting core services, enablers, and support offerings.

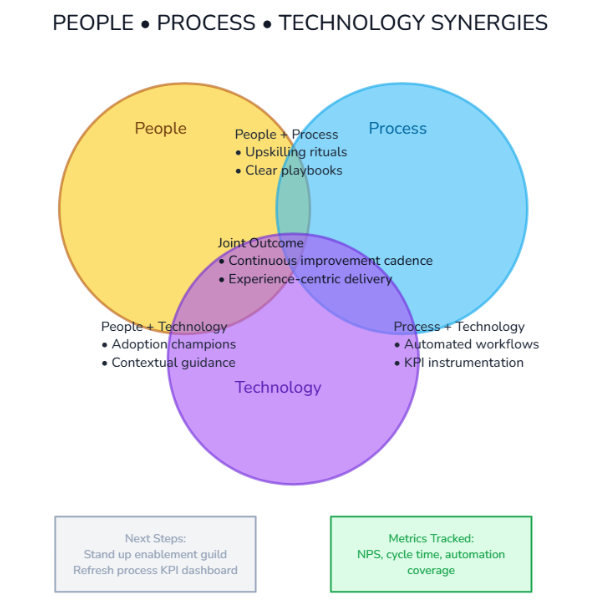
Operating Model Synergy Venn
Three-circle Venn linking people, process, and technology synergies with joint outcomes.

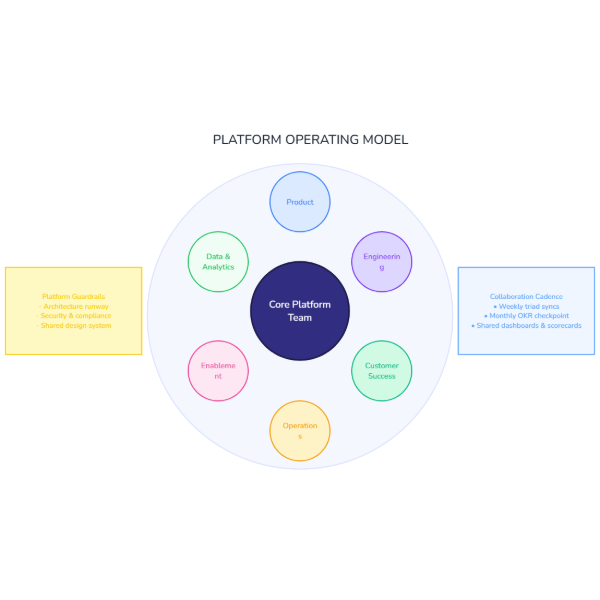
Platform Operating Model Map
Radial spoke cluster showing the core platform team and six surrounding functions aligned to the operating model.

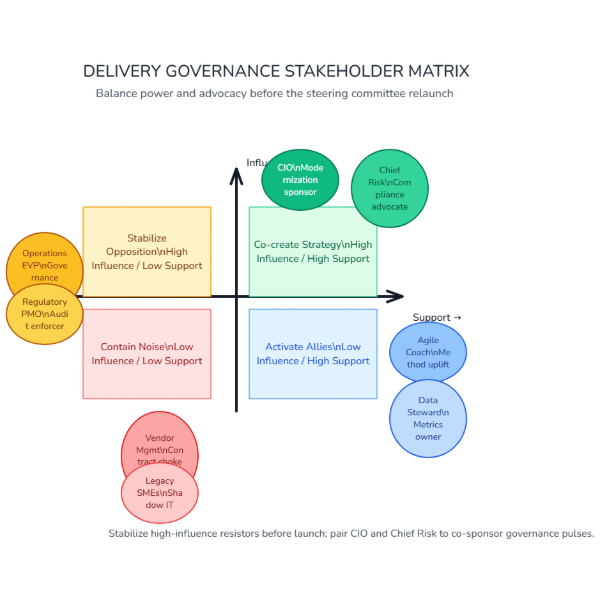
Delivery Governance Stakeholder Matrix
Stakeholder map for a delivery governance reboot, showing where to amplify support or mitigate resistance.

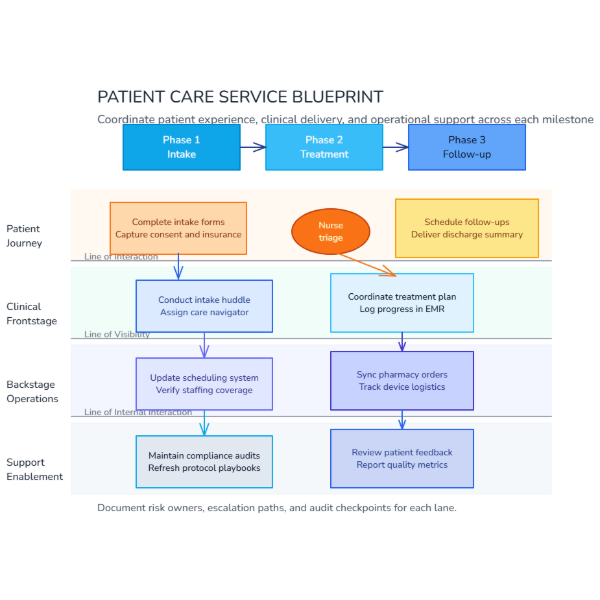
Patient Care Service Blueprint
Healthcare service blueprint that captures patient touchpoints, clinical frontstage actions, and backstage enablement through intake, treatment, and follow-up phases.

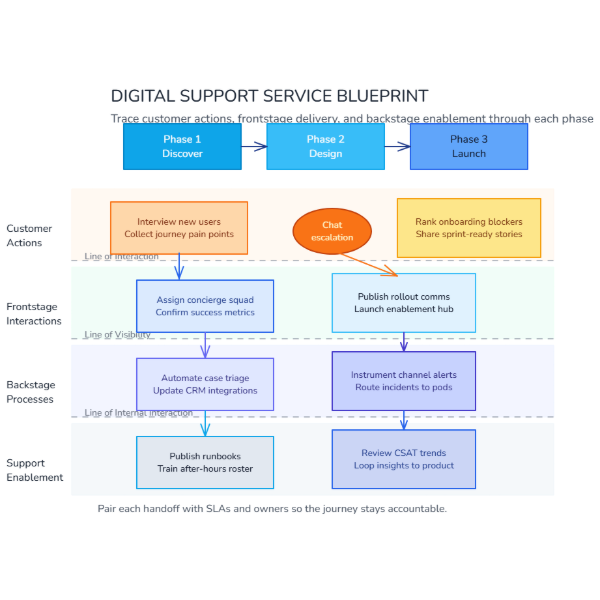
Digital Support Service Blueprint
Service blueprint that maps customer, agent, and platform interactions across discover, design, and launch phases for a digital support program.

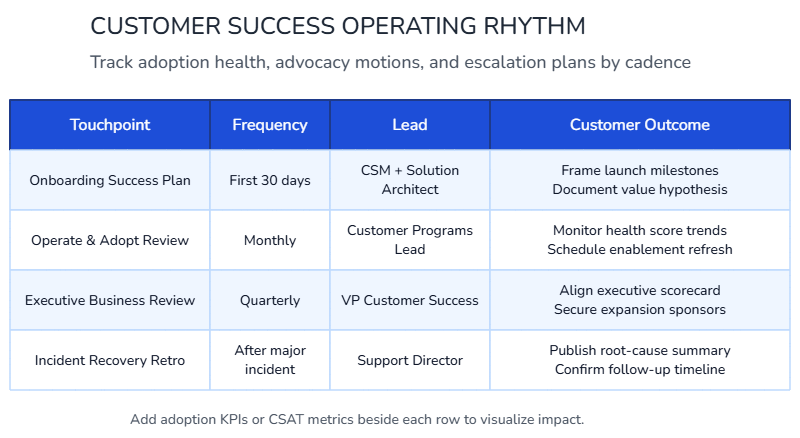
Customer Success Operating Rhythm
Customer success operating rhythm table that sequences advocacy, adoption, and recovery rituals across the fiscal calendar.

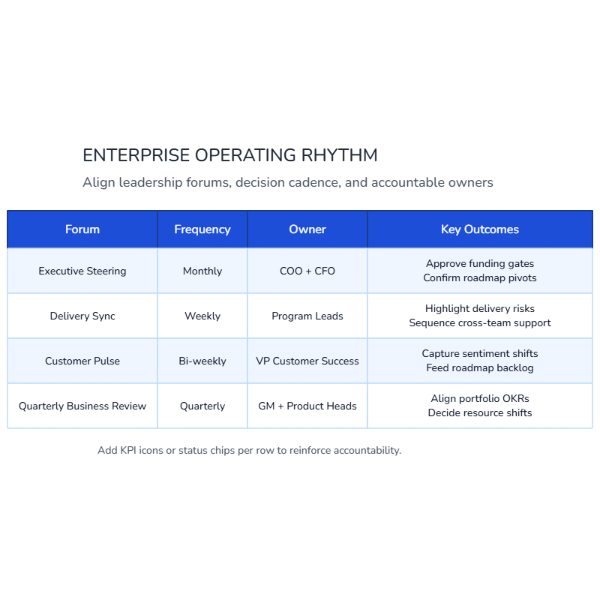
Enterprise Operating Rhythm
Enterprise operating cadence table that clarifies decision forums, meeting owners, and expected outcomes for each ritual.

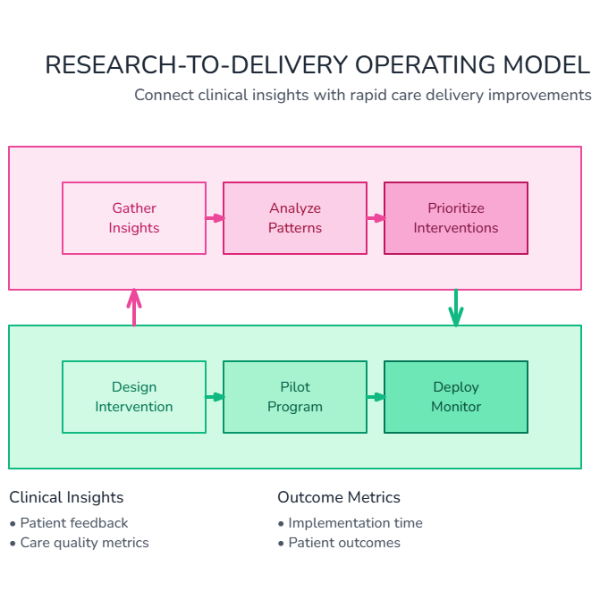
Research-to-Delivery Operating Model
Illustrate how customer research insights feed product delivery execution with metrics feedback loops for healthcare or life sciences.

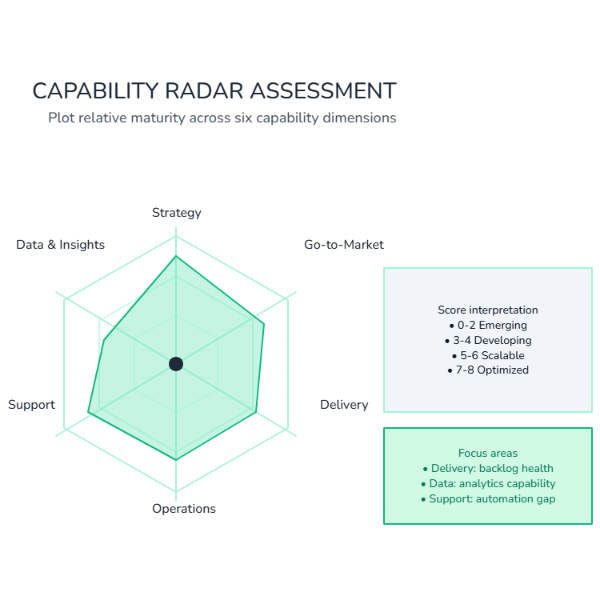
Capability Maturity Radar
Assess organizational capability maturity across strategy, delivery, operations, and support dimensions.
