Getting StartedDiagram Template GalleryConnect ChatGPT / ClaudeDiagram Creation and Enhancement FlowMermaid EditorPlantUML EditorGraphviz EditorD2 EditorExcalidraw Visual EditorFlowchartsSequence DiagramsER DiagramsClass DiagramsGantt ChartsAWS Architecture DiagramsPlantUML to ExcalidrawPlantUML AI EditorChatUML Alternative
Financial Reporting Diagram Templates
Browse diagram templates for Financial Reporting, compare formats, and start faster with AI-ready examples.
Filter by language or use case, preview templates, and jump into related docs before you start generating your own diagram.
Language
Active Filters
financial-reporting
Showing 1-2 of 2 templates
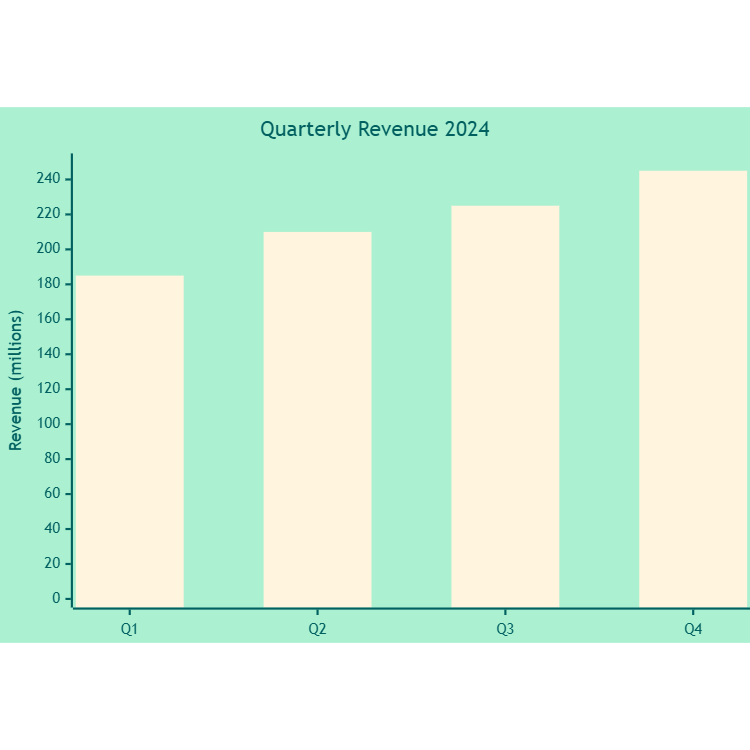
Quarterly Revenue
Single bar chart showing quarterly revenue performance
Template: XY Chart
Single Bar
Unlock with a free account
Start for free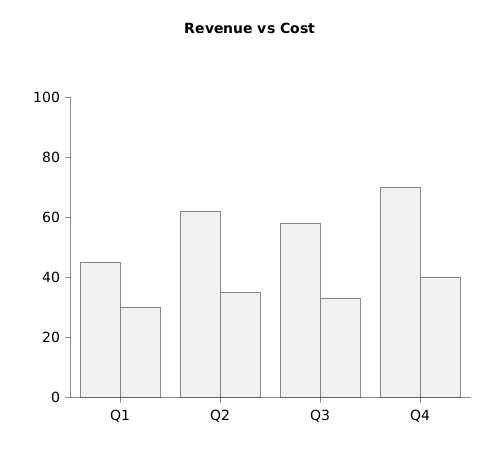
Revenue vs Cost Grouped Bar Chart
Grouped bar chart comparing revenue and cost per quarter
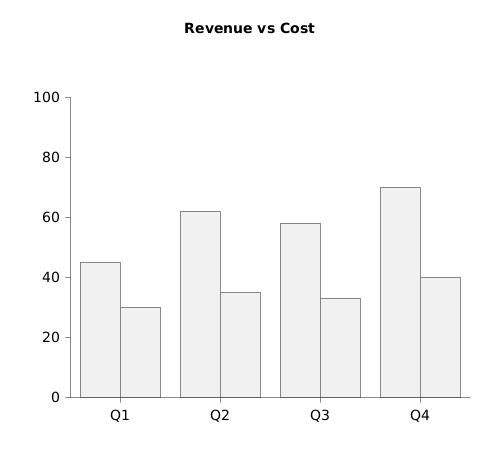
Template: Chart Diagram
Grouped Bar Chart
Unlock with a free account
Start for free